


5 Rules to Create Dashboards That Will Wow Your Clients
.png?width=88&height=88&name=portrait_agathe_face%20(1).png)
Agathe Huez
Publié le 09.02.23
Mis à jour le 13.01.26
7 min
A client dashboard is a visual management tool used to display data. KPIs and metrics are usually updated automatically, in real-time, and are used to update clients on project progress. There are a variety of benefits to using client dashboards, regardless of your business model, industry, or activity. Some of the biggest benefits are:
- Transparency: Using client dashboards, you can easily provide real-time updates to clients, transparently communicating their value. Additionally, they facilitate the sharing of data across teams, departments, and clients.
- Efficiency: It will save the reporting team time and effort by automating most of the data collection process (no more copying and pasting values every week).
- Personalization: You can customize dashboards to connect to multiple data sources and client accounts and display the most relevant information.
- Simplicity: There is no one who enjoys sifting through dozens of lines of data in order to identify critical metrics. By using client dashboards, you are able to see data from different teams and departments in one place, and be able to present results in a straightforward, easily understandable manner.
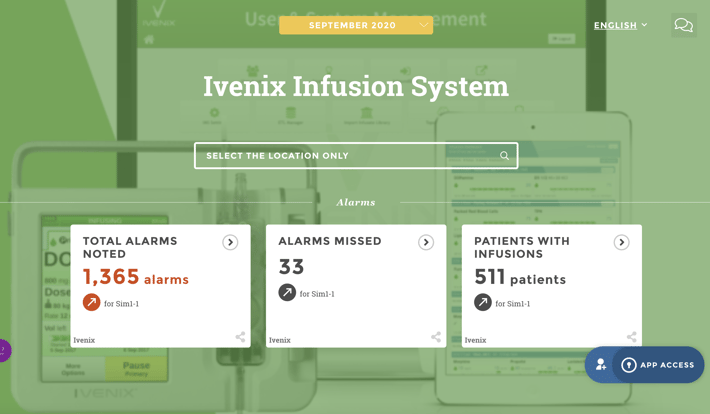
For client-facing businesses, dashboards are a modern (and often underrated) way to go above and beyond and visually provide transparent reporting data to clients. Dashboards need to be interactive, with live charts that are automatically updated to provide total transparency while requiring minimal time and effort commitment on the team. If you need help visualizing how they look, we have compiled a list of client dashboard examples for you.
What’s the difference between a client report and a client dashboard?
Perhaps you're wondering, don't client reports also provide metrics and marketing data? There is no doubt about it: they do. Client reports, however, are usually static, one-off documents, while dashboards provide real-time information. In addition to automated emails, reports are available as shareable links and embeddable files.
Using charts or bars reports demonstrate how one business variable has changed over time, like the popularity of your application. Dashboards take that a step further. They use data storytelling. This ensures that non-technical business users are also able to gain actionable insights from the data and don't need analysts to explain what everything means. Toucan has additional features like tips and glossaries adding more context and giving users the entire story behind the analytics and its implications.
Features you must have in your client dashboards
Client dashboarding has already proven its worth, but it’s crucial to keep in mind that the process is useless if creating your client dashboard takes you so much time that there’s none left to act on the data itself.
It is possible to import all of your data into Excel, but that would not be the best use of your time. The best way to centralize your reporting is to use a tool that allows you to do so. With this, you'll be able to create a client dashboard that lets you easily keep track of all your marketing activities. Toucan gathers data from multiple sources and client accounts. Not only will a reporting tool help you save time, but it will also simplify the process of creating dashboards by grouping all your marketing information into one place. Automating your reports is a great way to not only streamline your reporting but also scale your business by focusing on your digital marketing strategy more.
You'll be able to take your reporting game to the next level with Toucan's customization features. Our white-label dashboard features allow you to create a fully customized design and URL. No matter how you choose to present your dashboard to clients, there are certain dashboard design rules you shouldn’t ignore.
5 Rules to designing a client dashboard
Here are the 5 major rules for creating amazing dashboards for your clients.
1. Less is more
Obviously, you have a lot to say, and you probably want your client to know everything about every marketing detail. In the client dashboard context, "less is more" isn't just a minimalist motto; it's also completely applicable. The most important thing is to know which KPIs you should include in your dashboard since an awesome-looking client dashboard is meaningless without the right metrics.
In order to target the exact ones you need, ask yourself these questions:
- What is the business trying to accomplish?
- What are the business’s strategic goals?
- What are the actions that need to be taken in order to reach these goals?
- Which metrics can measure the success of these actions in terms of reaching the business’ strategic goals?
You need to add your ideal KPIs to your client dashboard once you ask these questions.
Dashboards aren't meant for heavy-duty data analysis; instead, they're intended to give business users actionable insights which help them make data-driven decisions. A good rule of thumb to follow is to have no more than 7 metrics in a dashboard as it was found that the human brain can focus on at most 7 things at a given time.
2. Know your audience
While you can’t go wrong by figuring out your client's KPIs, knowing who will use the dashboard you create can also help you tremendously. It is not necessary to include the same level of detail for every client. A manager will generally be interested in the "money" part of the report, such as Transactions and Revenue metrics, while a marketing specialist may require website visits and leads generated. Insights can also differ depending on the type of audience.
It is possible for one metric to be of great importance to one business unit, but of no significance to another. It is likely that the content writing team wants more focus on SEO, while the sales team does not care about that particular metric. Depending on the audience, you may even want to change the report's time horizon.
Creating a client dashboard involves a variety of factors, but the most important thing is knowing who your audience is and what they value.
3. Context is everywhere
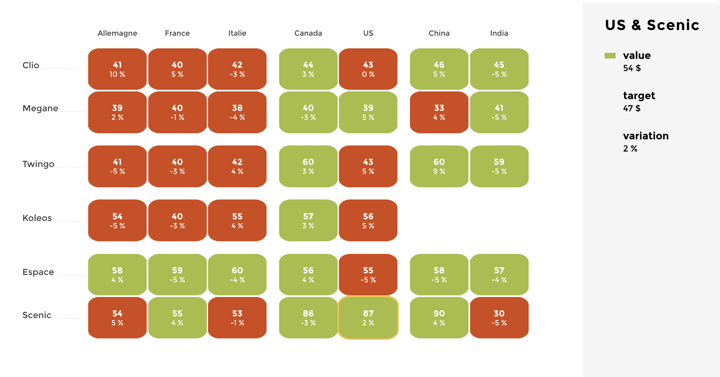
Data without context doesn’t mean anything! Never give a number without giving context and showing the meaning. For example, is an average conversion rate of 7% good? Who knows! It may be an awesome result for one business, but totally bad for another one. This is why Toucan offers color-coded metrics so users can understand this information at a glance.
To give your audience a hand in analyzing the results shown in your client dashboard, you should always give them a sense of scale. How? By making comparisons.For example:
- What was the conversion rate in the same period last year?
- What was it last period?
- What’s the average conversion rate for the entire site?
Even better, compare different segments: how is the conversion rate for each traffic source? Knowing the context is what will help you figure out the “why” of all these numbers.
There is always a fear of adding too much information, but with Toucan you don’t have to be worried about that. Context comes in the form of descriptions, headers, a glossary, a comments section and a “how to use the graph”. Having everything sectioned off means users can access the information when needed or simply obtain actionable insights from the dashboard itself.
4. Go beyond visuals
They say that a picture is worth a thousand words but you can get that even in a report. Visuals do not simply mean making data look pretty. It needs to go further. That is why Toucan focuses on data storytelling. Using data storytelling business users are able to see the full picture and understand how data-driven decisions and impact not just their teams but the whole organization.
So, once you’ve chosen the right metrics for your client dashboard, you need to be sure that data is displayed in a manner that makes it easy to understand for non-technical business users. How? Not with fancy icons, 3D effects, or things you see in Hollywood blockbuster movies. It has to be done with data storytelling.
One major thing to keep in mind tho is to choose the right chart type. Although this topic has a dedicated page on our website, it’s important to remember that each chart type is best for demonstrating certain things. The first step in choosing the right type of graph is asking yourself what you want your data to show.
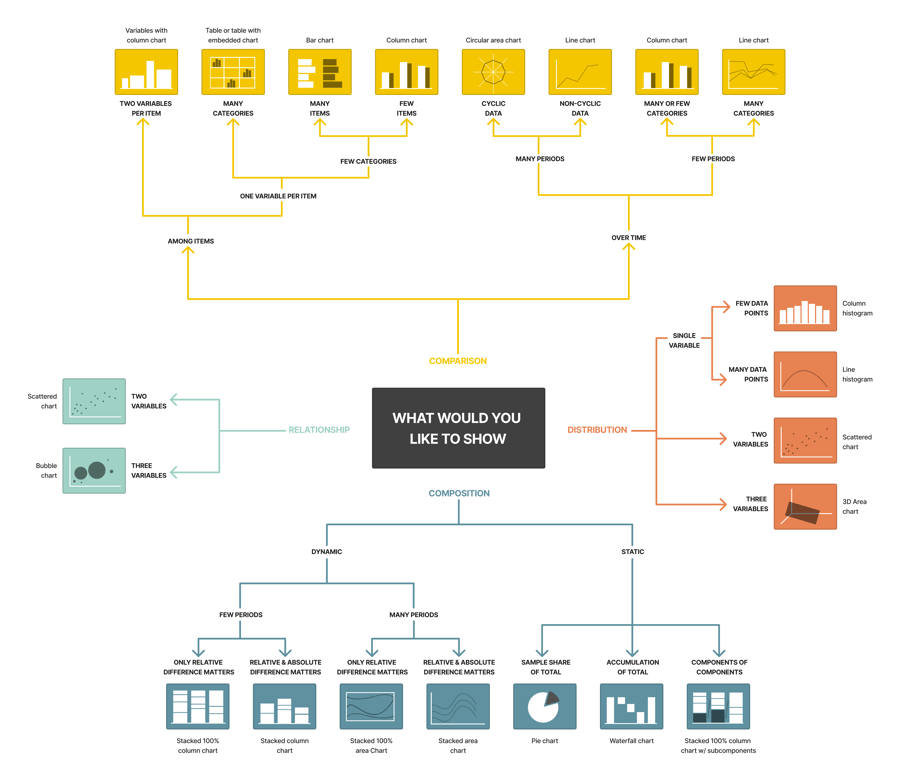
- Do you want to compare?
- Do you want to show the distribution over time?
- Do you want to analyze the composition?
- Do you want to illustrate the relationship between two elements?
- Or do you want to do something completely different?
Client dashboards are limited in space and information, so make good use of every pixel!
5. Add useful functionalities
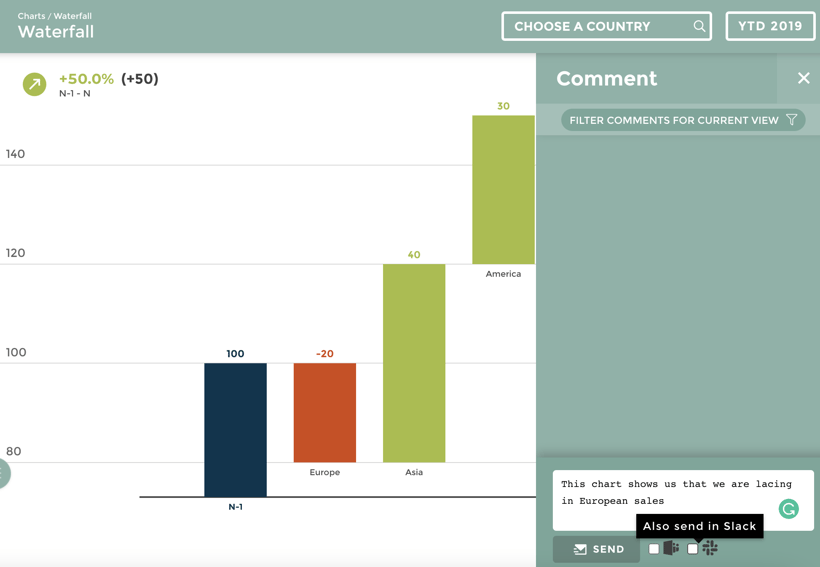
The features your reporting tool offers are important factors that can certainly help boost your dashboard adoption rate. For example, a dashboard created with Toucan can be shared in multiple ways, such as a PDF, a slack message or an email, and all with annotations. The dashboards are made on the philosophy of build once and deploy anywhere. This means that you only need to make a dashboard once and it can be seen on any kind of device from mobiles and tablets to flat-screen TVs.
To add more collaboration and increase adoption rates, Toucan comes with an inbuilt comments section this means users do not need to leave the dashboard to bounce ideas, ask questions or even reveal more insights.
The entire analytic solution comes with top-tier security and varied levels of access. This ensures that all users get exactly the insights that they need. Further being a 0-code platform you can build your client dashboards and deploy them without needing any technical help in as little as two weeks.
The biggest functionality that most client dashboards do not focus on is scalability. Yes, you can have analytics for right now but what about when your business grows and your clients have nigger needs. At Toucan we are banking on it, and that is why we are the best analytic solution on the market that is made to scale, just check out our G2 reviews.
Choosing who should build your client dashboard?
So now that you know what client dashboards are and how they can benefit your business, let's move on to the fun part: how do you build one? It can be done in three ways.
1. Developing in-house
A lot of companies take this dashboard design approach due to their lack of understanding of the analytics landscape that is in the market. They build client dashboards internally with the help of their development team, hard-coding the features, functions, and integrations.
Pros:
- Super customizable
- Total control over the data
Cons:
- Expensive (developer costs)
- Complicated and time-consuming
- Maintenance required
- Takes resources away from your core offering
2. Purchasing a third-party solution
Another option is to use a dedicated dashboard tool, such as Tableau or Qlik. These turnkey solutions allow users to create dashboards and custom reports but with advanced technical requirements.
Pros:
- Integrates with your stack
- Few ready-to-use dashboard templates
Cons:
- Expensive
- The steep learning curve for your team
- Data has to go through another loop (might cause security issues with clients)
- Limited personalization
3. Using a 0-code solution
The last option for dashboard creation is to build dashboards yourself with a 0-code platform like Toucan, with 1-click integrations. As a platform made for non-technical business users, anyone can build dashboards on toucan, letting you deploy your analytics in as little as 2 weeks.
Pros:
- Affordable
- Easy to set up, plenty of templates available
- Great for non-technical teams
- Offers white-labeling
Cons:
- You do have to do it yourself
So it turns out that the most affordable option also comes with the largest number of features and the easiest user interface. This is why most agencies prefer to partner with a 0-code analytics platform to create their client dashboards. This is why they partner with Toucan.
.png?width=112&height=112&name=portrait_agathe_face%20(1).png)
