


10 Key Employee Turnover and Retention Metrics to Track
.jpg?width=88&height=88&name=PORTRAIT_Baptiste%20(1).jpg)
Baptiste Jourdan
Publié le 29.11.22
Mis à jour le 13.01.26
7 min
Employee retention is the rate at which employees stay with a company. A company's strategies for preventing turnover and retaining employees may also be referred to as retention strategies. It is important to determine whether a company has successfully managed, hired, and trained its employees in order to ensure employee retention. A high retention rate can reduce a company's recruitment and onboarding costs and prevent productivity losses. Additionally, it can save a company time and money when it comes to hiring and training new employees.
Retaining good employees can also have other positive indirect effects on a business. By retaining employees for a longer period of time, employees are able to develop stronger workplace relationships and improve the company's culture. In addition to improving the efficiency of a company's core functions, it may also make it more attractive to prospective employees during the hiring process.
Employee retention metrics are the numbers that businesses measure to determine their effectiveness in keeping employees at their company. To improve retention, analysts often present these numbers as ratios and compare them with the company's goals. As a result, companies are able to measure employee satisfaction and monitor the causes of employee turnover.
When tracking employee retention metrics, businesses can obtain definite numbers regarding their performance. In many cases, this method is more accurate and useful than estimating employee retention or conducting employee surveys. The information provided by these numbers can assist business leaders in identifying areas where they can improve and establishing definite goals for the future.
Common employee retention metrics
A variety of metrics can be used to measure employee retention. Your choice of metrics will be determined by your goals. Here are a few useful metrics to keep an eye on when it comes to employee retention:
1. Employee retention rate
Employee retention rate is the fundamental metric for tracking employee retention.
It is an indicator of a company's ability to retain employees over time. In general, a good employee retention rate is greater than 90%. It is important to strike a balance between retaining current employees and allowing new recruits to join the company who possess more desirable skills and ideas.
Here is the formula for calculating employee retention:
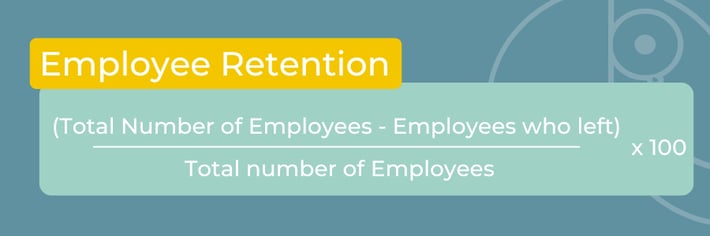
As an example, an organization with 700 employees lost 65 employees in the last year.
Employee retention rate = ((700-65) / 700) x 100 = 90.71%
2. Retention rate per category
It is possible to calculate employee retention rates across different categories in addition to your overall employee retention rate.
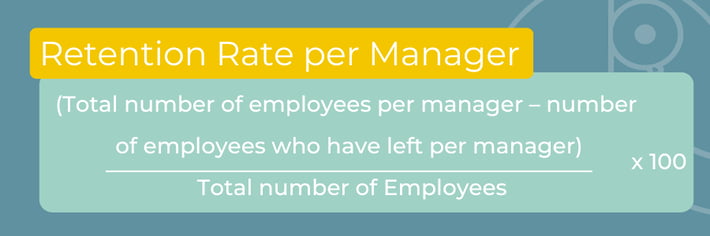
- Retention rate per manager
Examine how each manager is doing in terms of retaining employees. Having a high retention rate reflects well on the leadership skills of a manager, which can be used by others as a lesson. It is calculated as follows:
- Retention rate of managers
In addition, you might want to know how well you retain employees at the manager level. Having a low retention rate among managers could indicate that they are overburdened with management responsibilities or lack the tools to perform their duties effectively. The departure of many managers will have a knock-on effect on the organization's employees.
- Retention rate per department
The cause of a low retention rate in a particular department should be thoroughly investigated. It is also possible to learn from other departments with a higher retention rate by understanding the retention rate per department.
- Retention rate per age group
There may be a loose correlation between an employee's willingness to leave an organization and their age group. The ability to intervene in a timely manner can be enhanced by understanding the reasons for leaving for various age groups.
- Retention rate per ethnicity/race group
Maintaining your DEI&B goals requires an understanding of ethnicity/race retention rates. Retention rates can indicate a non-inclusive work environment if a particular group has a noticeably poor retention rate.
- Retention rate per gender
Additionally, you might consider diving deeper into the reasons why you are retaining employees of one gender at a lower rate than other groups.
- Retention rate by performance levels
Understanding whether you are losing your high performers or low performers is crucial.
To analyze retention rates in-depth, two or three of these categories are typically used. The retention rates in the finance department might, for example, be measured among individuals between the ages of 25 and 34. In addition, the retention rate of women in managerial positions is examined. Calculate employee retention rates by category using the following formula:
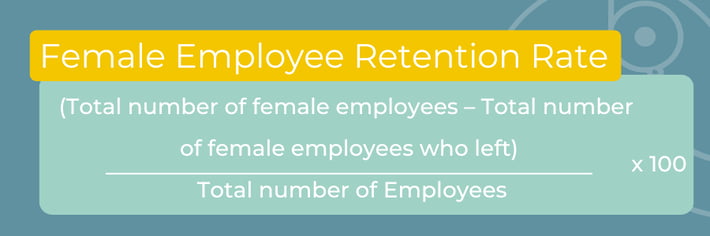
As an example, let’s say an organization has 3,200 female employees. At the end of the year, they have 2,700 female employees. So the retention rate is (3,200 - 500)/3,200 = 84.36%.
This percentage can then be compared with other categories within the organization and their retention rates. By doing so, you will be able to determine whether there is a need for concern and then implement any necessary measures to address it.
3. Voluntary turnover
Voluntary turnover refers to the number of employees who voluntarily leave their jobs. Employees who leave their employers voluntarily indicate that they have made this decision on their own. A voluntary departure from an organization may be caused by a number of factors, such as finding a new job, joining a more desirable brand, or relocating.
It is important to understand your voluntary turnover and the reasons for it, as this will facilitate the development of strategies an employer can use to retain their team members.
The following formula can be used to calculate voluntary turnover over a year:
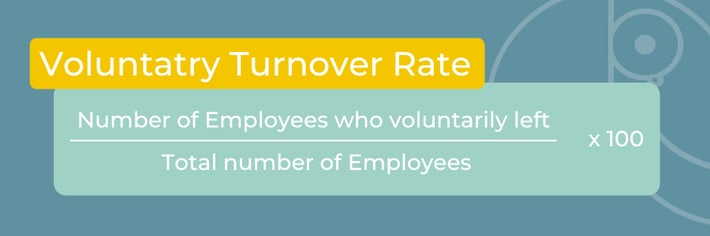
As an example, let’s say an organization has 2,500 employees. During the year, 350 employees leave voluntarily. The voluntary employee turnover rate would be 350 / 2,500 = 14%
It is recommended that an employer's voluntary turnover rate not exceed 10%.
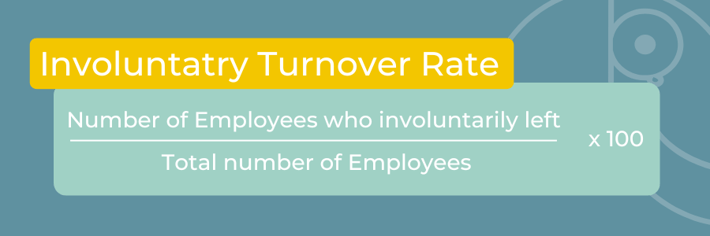
4. Involuntary turnover
Involuntary turnover is the percentage of employees who have been dismissed or laid off by the company in a given period. Involuntary turnover is indicative of poor workforce planning or a lack of initiative to develop employees.
For calculating the involuntary turnover rate, you can use the same formula as the voluntary turnover rate, but replace the “number of employees who left voluntarily in a given period of time”, with “number of employees who left involuntarily (dismissals or layoffs) in a given period of time.”
5. Employee satisfaction rate
Employees who are satisfied with their jobs are more likely to remain in those positions for a longer period of time. The definition of a happy employee is one who is challenged by their work, feels valued by their organization, and feels fairly compensated.
In order to drive employee satisfaction rates higher each year, HR should set ambitious goals. A common metric used to measure employee satisfaction is the employee net promoter score (eNPS).
In order to measure this metric, you could ask the question “On a scale of 1-10, how likely are you to recommend this organization as a place to work? ” or “Based on your experience, how likely are you to recommend our organization to a friend or colleague?”
Using the responses, you can categorize them as detractors, passives, and promoters:
- Promoters – Employees that respond either 9 or 10, which is an indication that an employee is satisfied.
- Passives – A score between 7 and 8 indicates the employee is neither happy nor unhappy but feels neutral. They won’t recommend the company to a friend, but they won’t bad-mouth them either.
- Detractors – Any employee that gives a score below 6, which indicates that the employee is not satisfied.
To calculate eNPS, the formula is:
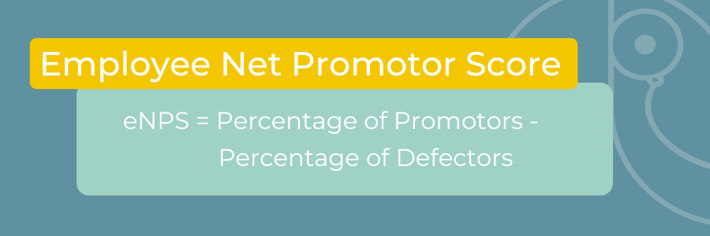
A score of more than 0 is considered satisfactory. Scores between 10 and 30 are considered good, while scores over 50 are considered excellent.
Additionally, you can focus on your new hire satisfaction rate to ensure employee retention.
6. Average employee tenure
Employee satisfaction can be determined by understanding how long employees stay with an organization on average. Average employee tenure is calculated by averaging the tenures of all employees with the total number of employees. The longer the average employee tenure, the more satisfied the employees are, and therefore the higher the retention rate. The following formula can be used to calculate the average employee tenure:
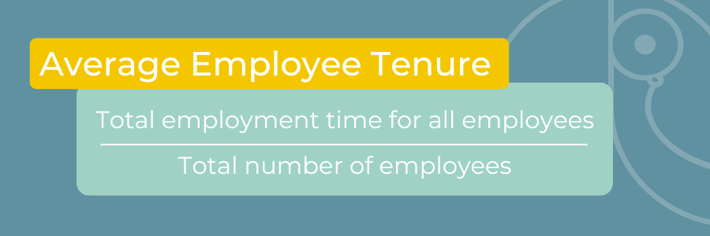
Human Resource professionals can utilize this metric across various departments or groups to identify potential concerns.
7. Cost of employee turnover
A company's success depends on retaining employees since turnover is costly. Calculating employee turnover costs requires data collection and assigning a dollar value to each cost. For example, consider the following:
|
Cost |
Amount |
|
Monthly salary of departing employee |
$4,000 |
|
Cost of advertising |
$2,000 |
|
Background checks |
$100 |
|
Cost of time away from the job for the hiring manager to conduct interviews |
$800 |
|
Cost of covering vacancy |
$6,000 |
|
Onboarding costs of new hires |
$10,000 |
|
New hire first 3 months of training / non-productivity |
$12,000 |
|
Total |
$34,900 |
8. Engagement scores
An employee's engagement is an important indicator of whether or not he or she will remain with the company. Engagement scores can be collected in a number of ways, such as through pulse surveys or engagement surveys.
A pulse survey is a short set of questions asked continuously to understand people's perceptions of their work environment. For example, an employee may see this pop-up when they arrive at work:

Based on the aggregate set of responses to pulse survey questions, the organization will be able to determine how engaged or disengaged its workforce is. An additional method of measuring engagement is to ask a series of questions in a survey. Surveys may be conducted quarterly or annually, depending on the organization's culture. Following is a list of some possible questions, rated from 1 to 10:
- Do you feel valued in your role?
- Do you feel that your job is allowing you to use your skills?
- Do you have a good relationship with your manager?
- Do you see a career path to advance your career within the organization?
- Do you feel the organization prioritizes your well-being?
9. Job satisfaction
An employee's job satisfaction measures their level of happiness at work. It is more likely that dissatisfied employees will seek employment elsewhere. Employee Satisfaction Index (ESI) consists of three questions to measure employee satisfaction with their job. The following questions are rated on a scale of 1 to 10:
- How satisfied are you with your workplace?
- How well does your workplace meet your expectations?
- How close is your workplace to your ideal job?
The formula to calculate ESI is:
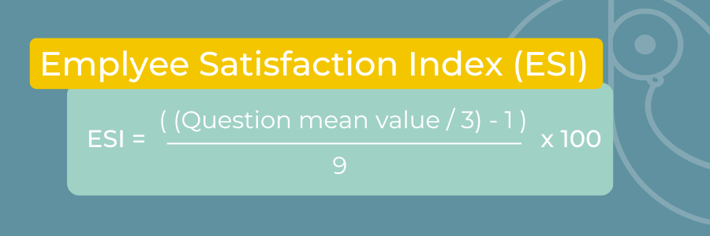
The ESI will result in a score between 0 and 100. A higher number indicates a higher level of employee satisfaction. Based on your score, ESI allows you to track improvements over time.
This three-question survey can be integrated into a more extensive employee engagement survey. You can pinpoint what frustrates your employees and what you can improve by including open-ended questions in such a survey.
10. Flight risk
While it would be great to be able to identify employees who are likely to leave, it is not always possible to predict the future. The following are some indicators of employees who are likely to leave:
- Employees that are paid below the market
- Employees who perceive their pay is low (even though it may not be)
- Employees that have recently changed roles (or managers)
- Employees that went through a significant life change
- Employees that experience low to minimal career progression
Why you need to measure employee retention
- It is beneficial to analyze employee retention in order to gain valuable insight into who leaves and when, as well as who stays. As a result, you are able to determine whether the organization is losing its best employees.
- A high level of employee retention indicates a high level of employee satisfaction. An employee who is satisfied with their work environment is less likely to leave the organization. Improved employee retention can also be achieved by increasing compensation or providing more professional development opportunities.
- You can identify issues early in the retention process and take appropriate action by tracking employee retention. As an example, if employee retention is lower than average in one of the departments, you can conduct a deeper investigation into the matter and uncover and address the causes.
- It is important that you understand what you need to focus on and if your strategy works once you have implemented it. This is something that can be assessed by employee retention metrics.
- During the recruitment and hiring process, the employer loses time, money, and effort when an employee leaves a position. After the replacement is hired, he or she must be trained and onboarded. Turnover expenses are estimated to cost employers over one trillion dollars annually, so the importance of employee retention cannot be overstated.
- Having a reputation for retaining employees leads to being seen as an employer of choice. Conversely, if employees leave regularly, it can negatively affect your external recruitment efforts, especially since social media is readily accessible to them.
- Having employee retention metrics readily accessible in your analytics solution with actionable insights helps employees know their opinion is valued and shows the actions that can be taken. An example of the best analytics solution that can provide those analytics and insights is Toucan.
.jpg?width=112&height=112&name=PORTRAIT_Baptiste%20(1).jpg)
