The first step in ensuring the sustainability of your business finances is to understand your cash flow. Cash flow refers to how much money comes into and leaves your company during a given period of time. Cash flow is an indication of financial health if there is more money coming in than going out. It is important to understand cash flow metrics and key performance indicators (KPIs) so that you can ensure you have enough funds for your business to grow and pay your bills.
Metrics are quantifiable measures of business functions. An organization's cash flow metrics can be used to measure its performance. In addition to helping you make decisions, these measures can also help you assess the quality of economic policies. Additionally, investors use the information to compare companies.
Metrics and KPIs for operating cash flow
Here we are going to examine ten key operating cash flow metrics and KPIs that businesses should be tracking regularly throughout their annual business operations.
1. Days sales outstanding (DSO)
DSO represents the average number of days it takes to collect payments following a credit sale.
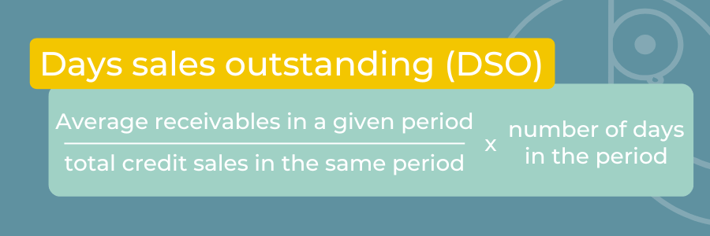
In terms of cash conversion cycles, a low DSO indicates that you are able to collect dues from your customers more quickly. High DSOs may indicate poor collection practices and cash flow problems.
For example, a clothes retailer has accounts receivable of $60,000 for the quarter. For the same quarter, the value of sales is $150,000. There are 90 days in the quarter.
This retailer’s DSO for this quarter = ($60,000/$150,000) x 90 days = 36 days. The standard for what’s a reasonable DSO varies by industry. In retail, that might be around seven days, whereas in manufacturing it might be closer to 60. Monitor trends over time and compare your performance against peer companies.
2. Days payable outstanding (DPO)
It can be argued that DPO is the reverse or opposite of DSO. It is a measure of the amount of time it takes a business to pay its suppliers on average.
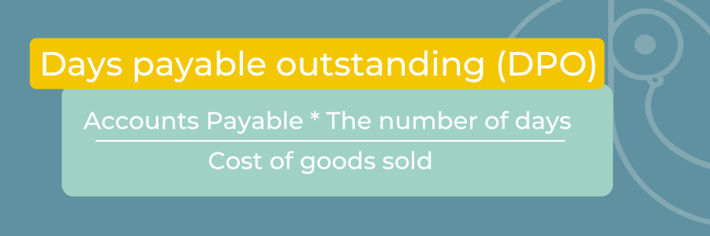
- Cost of goods sold = Beginning inventory + purchases – closing inventory
If you have a higher DPO, you will be able to retain cash for longer and invest it in the short term for higher returns. However, a very high DPO can also indicate that your credit terms may be at risk in the future. If your DPO is low, this may indicate that your business is not taking advantage of the available credit terms or is not negotiating for better terms. In the same way as DSO, DPO can also vary from one industry to another.
For example, a company's accounts payable averages was $200,000 per year. Its COGS for that same year is $3,000,000. The number of days in that period is 365.
This company’s DPO = ($200,000/$3,000,000) x 365 = 24.3 days. Therefore, this company takes an average of 24.3 days to pay its accounts payable. Around 30 days for creditor days is usually considered an excellent DPO.
3. Accounts receivable turnover (ART)
Accounts receivable turnover ratios provide insight into a company's collection efficiency. It is calculated by dividing net credit sales by average accounts receivable over a given period of time.
It is a measure of how often receivables are converted into cash in a given period of time. Alternatively, it is known as debtor turnover ratio.
Companies with a high ART are better at collecting receivables. The company with a low ART either has trouble collecting from its customers or offers clients too lenient payment terms.
For example, a company has a beginning accounts receivable for the year of $80,000 and an ending accounts receivable of $94,000. Its average accounts receivable for the year = ($80,000 + $94,000)/2 = $87,000. Its net credit sales for the year were $900,000.
This company’s accounts receivable turnover ratio = $600,000/$52,000 = 17.3. This means that the company turned its receivables into cash 17.3 times for the period. Whether this ratio is appropriate for this company depends on its payment policy.
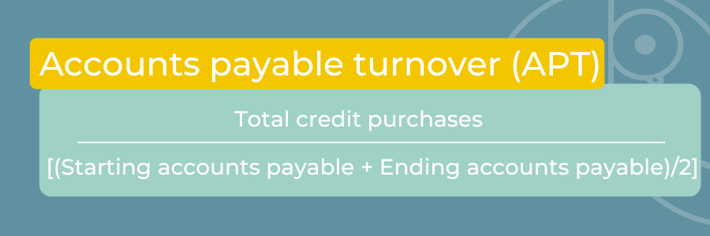
4. Accounts payable turnover (APT)
A company's accounts payable turnover ratio, also known as its creditor's turnover ratio, measures short-term liquidity and indicates how often it pays its creditors or suppliers.
Having a higher APT may indicate that your company is not effectively utilizing its credit terms, or that your suppliers are not extending favorable credit terms. A lower APT indicates that your credit lines are being used effectively; however, a very low APT may cause friction in your supplier relationships.
For example, a company has a beginning accounts payable of $10,000 and ending accounts payable of $19,500 during a year. For that period, the business purchases, on credit, $30,000 worth of new equipment.
This company’s accounts payable turnover for the period is $30,000/[($10,000 + $19,500)/2] = 1.5. This means that the business pays its average accounts payable balance more than 1.5 times every year. Compare this value to other companies in the industry and the vendor payment terms.
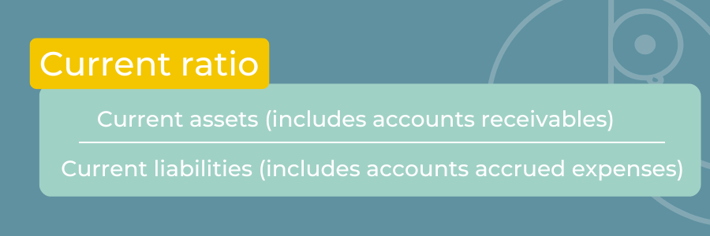
5. Current ratio
The current ratio measures the relationship between current assets and current liabilities. Basically, it indicates how well a company can pay off its short-term obligations.
The higher the ratio, the more likely the business is to be able to repay its short-term loans. A low ratio may indicate that the business will have difficulty paying its bills in the near future. Therefore, customer accounts with a low current ratio are more likely to have open invoices turn into bad debts.
It is generally considered healthy to have a current ratio between 1.5 and 3. When the current ratio is 2, the company has twice the amount of cash or assets needed to cover its short-term obligations.
For example, a large company reports (in millions) current assets of $55,000 and current liabilities of $35,000.
This company’s current ratio = $55,000/$35,000 = 1.57. This value means that this company is meeting its financial obligations but could improve.
6. Free cash flow (FCF)
A business's free cash flow is used to repay its creditors, pay interest, and distribute dividends. The cash available to a business after paying short-term liabilities and investing in operational equipment is called working capital.

The company with a high FCF indicates that it has a good operating cash flow and excess cash available to make further investments, pay off debts, or pay dividends.
For example, a small business reported $57,000 for its operating cash flow and spent $18,000 on new equipment for the period. This business’s free cash flow = $57,000 - $18,000 = $37,000. Accordingly, the small business has $37,000 available for use in improving its operations.
7. Cash flow coverage ratio (CFCR)
A business's CFCR ratio indicates whether its cash flow from operations can cover its debt obligations. In other words, it is the ratio between cash flow from operations and total debt.

If the CFCR is high, it indicates that the company is in a good position to repay its debts. Businesses should have a cash flow coverage of at least 1.5x. For instance, a CFCR of 1.5 means that a company has $1.5 in operating cash flow to cover $1 in interest costs.
A cash flow coverage ratio of less than 1.5 may indicate that the company has poor debt management practices or has difficulty making timely interest payments.
For example, in a company's cash flow statement (in millions) last year, its cash flow from operations was $15,000, and total debts were $75,000. This company’s CFCR = ($15,000 / $75,000) x 100 = 20%. Next, you can estimate how long this debt would take to pay off if all these conditions stay the same. The number of years = 1/20% = 5 years.
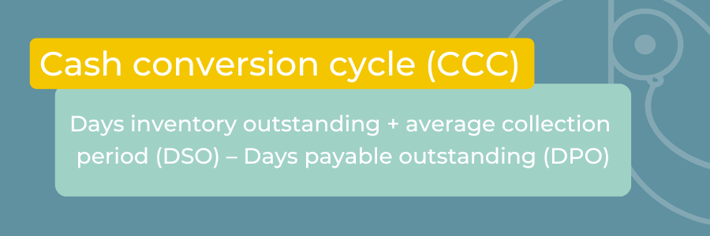
8. Cash conversion cycle (CCC)
A company's cash conversion cycle, also known as its net operating cycle, measures how long it takes to convert inventory and investment into cash. The duration is measured in days.
It measures the time taken for each dollar invested in production and sales processes to be converted into cash payments. As part of this analysis, the time taken by the company to sell its inventory, collect receivables, and pay its bills is taken into consideration. If the CCC is lower, the company is more likely to be able to collect payments more quickly and is more liquid.
For example, a company reported (in millions) $1,000 in average inventory, with COGS at $30,000. Its average accounts receivable for this period was $2,000 and credit sales were $50,000. Finally, this company reported its average accounts payable as $1,500. Putting this together,
DIO = ($5,000/$30,000) x 365 = 12.2.
DSO = ($2,000/$50,000) x 365 = 14.6.
DPO = ($1,500/$30,000) x 365 = 18.75.
CCC = 12.2.6 + 14.6 – 18.75 = 8.05.
It takes this company about 8 days to turn its original cash investment to inventory and then back into cash.
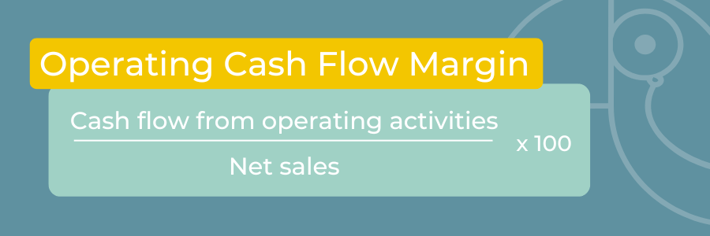
9. Operating cash flow margin
In business, operating cash flow margin measures a company's profitability and quality of earnings. In a given period, it is the ratio between operating cash flow and sales revenue.
Positive percentages indicate good profitability and operational efficiency. Negative percentages indicate that the company is losing money. In order to compare businesses within the same sector, cash flow margins can be used.
It is important to have timely collections in order to maintain a strong operating cash flow margin. Strong cash flow companies are those that have an operating cash flow margin of more than 50%.
For example, a company had (in millions) cash flow of $9,000 and net sales of $15,000, and its cash flow margin = ($9,000 / $15,000) x 100 = 60%. There is definitely a good line of profitability here.
10. Forecast variance
Forecast variance measures the difference between your cash forecasts and the actual outcome. It is important for businesses to track the variance between their forecasted and actual cash flows in order to determine how accurate their estimates are.
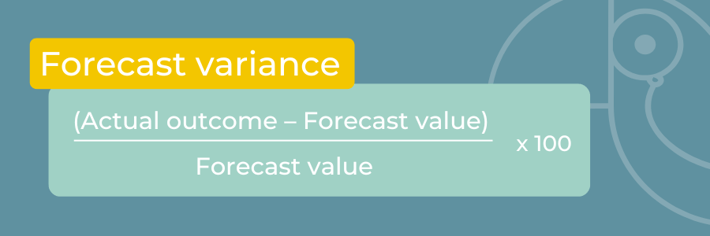
Making better business decisions is made possible by tracking forecast variance over a period of time. The higher the forecast variance, the less likely it is that you are using the right variables in your model or that you need to change the input parameters. The lower the forecast variance, the stronger the predictive capability and the better the ability to make decisions.
Let us take the example of a small business that forecasts $15,000 in product costs for the year. The actual product cost turned out to be $17,200 This company’s forecast variance = [($17,200-$15,000) / $15,000] x 100 = 14.67%. In January, the business may have improved due to a significant event. Forecasts can be based on this information in the future.
How to pick financial KPIs that are suitable for your business?
In order to optimize resources, including FTE time and effort, you will need to choose the right metrics to track operating cash flow efficiency. However, this can be a challenging task. The following tips will assist you in selecting the best cash flow metrics for your organization.
- Don’t measure everything: If you attempt to track all financial metrics, you will only become confused and not be able to focus on the most important ones. Identify the metrics that you would like to track based on your business objectives and the impact you wish to achieve. If you would like to reduce debt by 50% within the next two years, you should monitor FCF, current ratio, and FCFR.
- Are KPIs providing the full picture: As soon as you have chosen a set of operating cash flow KPIs to track, assess periodically whether they provide you with a comprehensive picture of what you are seeking. Otherwise, you should examine which metrics should be added to your tracker and which metrics can be removed from it. It is important to reassess the metrics you are tracking based on changes in your business goals.
- Ask for outside consultation: Consult with third-party experts if your business does not have sufficient resources or expertise in the finance domain to set up trackers and dashboards to track your most relevant financial metrics.
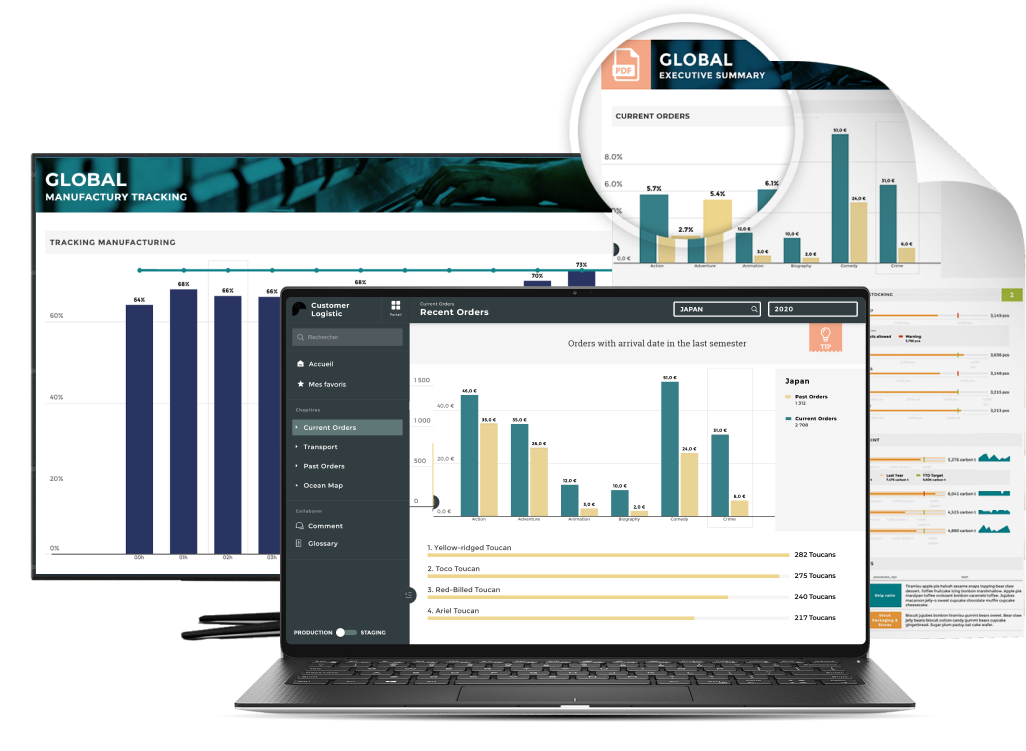
- Automate the process with software solutions: Software solutions such as Toucan allow you to integrate data from multiple locations and track the most relevant cash flow metrics. The use of automation tools provides real-time data and visual representations of key metrics.
Effectively tracking metrics
Every business relies heavily on cash flow. Keeping track of the KPIs and metrics related to operating cash flow is critical to avoiding cash crunches, debt issues, and even bankruptcy.
You would not be able to receive real-time updates by manually tracking operating cash flow metrics. The use of poor-quality data to track operating cash flow KPIs can negatively affect your business's day-to-day operations and investment plans. As a result, stakeholders will also be unhappy.
Monitor operating cash flow metrics in real-time using analytics tools like Toucan. Toucan offers guided analytics that helps streamline and track your accounting, accounts receivable management, and treasury operations.