Résumer cet article avec :
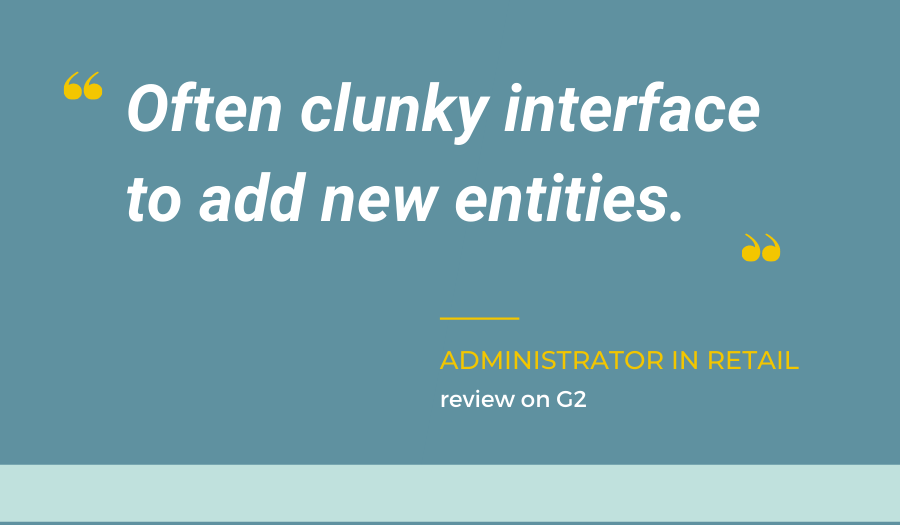
Board categorizes itself as a decision-making platform instead of an analytics or insights solution. This may be primarily due to the static nature of their visualizations that don’t give much in terms of content or value to the data. If gaining insight was hard, navigating the Board platform is harder. It is not intuitive or made with a user-first approach in mind. The biggest downfall of Board however is the inability to collaborate with team members effectively. For a static platform, the best use would be to use it and explain the meaning of data to team members. But sadly Board fails to deliver on that front.
With a platform that is somewhere in between excel and analytics, you might not get all the features you need to grow your business. That is why we have complied the 5 best alternatives to Board that can provide more insights into your data.
01. Toucan toco
Guided analytics ✅
Easy collaboration ✅
Dynamic visualizations ✅
Toucan toco is built to be a customer-facing analytics platform. It is the highest-rated analytics platform on G2. This is because it aims to democratize data and enable users of all technical levels to gain actionable insights using analytics. The visualizations in Toucan are interactive, with filters, dynamic charts, color coding and more. There is so much context at every step that your users will never get lost in the platform.
The best part of Toucan is its extensive ability to collaborate. The platform comes with an inbuilt comments section, so users don’t have to leave the app to discuss their findings of a chart or graph. Further, you can annotate and share, this means you can send a graph to any team member as a pdf, email or through Slack with your annotations in it. Toucan makes sure that being remote doesn’t affect the quality of your collaboration or work. This makes Toucan the best alternative to Board
02. Anaplan
Guided analytics 🚫
Easy collaboration 🚫
Dynamic visualizations 🚫

Anaplan isn't really an analytics solution. It is a pretty way to see your data with little to no context. The analytics is not guided at all making navigation extremely difficult. The process of building out modules in Anaplan should be reserved for users with a least 5+ years of experience in data modeling and analytics. Customization with Anaplan is almost nonexistent. Giving it an extremely static look. It is poor for reporting and cannot be made to fit your brand.
Collaboration with Anaplan is on the same level as excel. The only upside is that it looks prettier. The reason Anaplan is on this list is because it focuses more on decisions making, the promise that Board fails to fulfill. So if you need a better way to look at your data without analytics or insights, Anaplan is the best alternative to Board.
03. Planful
Guided analytics 🚫
Easy collaboration 🚫
Dynamic visualizations 🚫

Planful is a finance-specific decision-making Tool. It has many of the same downfalls as Anaplan where it was never made to be an analytics solution in the first place. The platform is not guided, though it is easy to understand and use due to its minimal features and simplistic nature. The issue arises with onboarding where the team seems to be under-educated about the product leading to unnecessary delays.
The visualizations are static, something that can be done on free software like Google data studio. The collaboration aspect is missing from the platform making it more of a personal view for users which can be printed and shared. The support team is slow to answer questions and get back with actionable solutions. Overall if you need a finance-specific way of looking at your data, Planful is the best alternative to Board for you.
04. Qlik
Guided analytics 🚫
Easy collaboration 🚫
Dynamic visualizations ✅
Qlik is known to be an extremely technical platform. The analytics is far from guided. In fact to be able to use the analytics users have to learn a special scripting language unique to Qlik. This ensures that non-technical users are unable to gain any insight into the data available. The visualizations in Qlik are definitely dynamic, even though the customization is limited.
Collaboration is where Qlik really struggles. Since the platform is heavily reliant on technical users, it becomes hard for others to collaborate on the platform. But downloading graphs isn’t easy either. This makes it so that users have to resort to sitting together or taking printouts and writing notes to get their points across. The visualizations alone push click above Board, making it a great alternative to Board.
05. Tableau
Guided analytics 🚫
Easy collaboration 🚫
Dynamic visualizations ✅
Just like Qlik, Tableau is also a highly technical platform. Even with its higher level of difficulty, it seems to be easy to navigate with a great user interface. Though not a fully guided analytical platform, Tableau ensures that with some help most users are able to build analytics and get insights. The visualizations on the other hand are stiff. A lack of customization has been a major issue with Tableau with no change in sight.
In terms of collaboration, Tableau doesn’t provide a dedicated way for non-technical users to be a part of the conversation. They are reliant on their technical counterparts to give them insights which they share with the team. Even with this bottleneck, Tableau outshines Board, making it a great alternative to Board.
.png?width=112&height=112&name=portrait_agathe_face%20(1).png)
Agathe Huez
Agathe is Head of Brand & Communication at Toucan, with over 10 years of experience in marketing, branding, and corporate communication, particularly in the SaaS and tech B2B sectors. An expert in brand strategy, storytelling, and public relations, Agathe helps businesses give meaning to their communication and showcase their expertise to clients and partners. She plays a key role in growing Toucan’s visibility and positioning as a leading embedded analytics solution, both in France and internationally. On Toucan’s blog, she shares insights on how to build impactful B2B brands, create memorable experiences, and turn data into a true competitive advantage.
Voir tous les articles

.png?width=88&height=88&name=portrait_agathe_face%20(1).png)
