


3 CFO Dashboard Examples That Will Replace Your Excel Tables
.png?width=88&height=88&name=portrait_agathe_face%20(1).png)
Agathe Huez
Publié le 19.08.22
Mis à jour le 13.01.26
4 min
Storytelling is the oldest form of education, so allow us to tell you a story about John, a CFO at ShipIt. ShipIt is an established, global logistics firm and John is an extremely qualified decision-maker, transforming multiple businesses in the industry into success stories.
Like many of the executives in his field, John has perfected a workflow that has been solidified through decades of trial and error. As of 2019, ShipIt was growing and John was making the correct decisions based on instinct and expertise.
Fast forward to 2022. ShipIt has taken massive hits through no fault of John's. The COVID-19 pandemic has disrupted supply chains across the globe, putting a huge dent into the firm's bottom line. Fears of a global recession and consumer spending decreases are not helping matters. Put simply, ShipIt is at a crossroads.
Although John has experienced external problems with multiple companies, such as the 2008 housing crisis, he has never seen such dramatic changes in growth while his team is following his instructions.
The CFO has never really paid much attention to modernizing his data stack. As an older executive who dismissed data tools as an expensive luxury, John has always felt comfort in viewing his Excel-generated reports on a quarterly basis, with occasional ad-hoc reporting a handful of times throughout the year.
ShipIt's IT team has regularly pleaded with John to modernize his department's data stack and promised results, which John regularly refused.
John knows his decisions are not a result of incompetence or poor leadership, but what he doesn't know is the insights that would have driven growth for ShipIt. During COVID-19 online shopping sales exploded by 43%, and a robust shipping contract with top retailers would have grown his already established business. ShipIt dabbled in retail shipping, but it made up only 15% of the business's revenue.
So clearly, lack of insights was the issue. Because of the quick changes in the logistics landscape, John completely missed the success of his retail shipping contracts amid other tanking areas of the business.
John has all of the makings of a great CFO, but his reluctance to branch out into a reporting solution was the misstep that set ShipIt on the back foot.
A modern data visualization solution would have tracked all elements of ShipIt's financial health in real-time and indicated that redistributing resources to increase the number of retail contracts in 2020 would have increased ShipIt's bottom line. John could have then reported this insight to other members of the executive board and averted disaster.
John's situation is all too common across financial departments in every industry. The lack of a simple insight that would have been readily available cost ShipIt valuable time and resources. With the stage being set, let's talk about the solution for John's finance department.
WHY CFO Dashboards?
CFO dashboards are a vital workflow addition to the modern finance decision-maker. For most businesses, the results dashboards generate far outweigh the minor inconvenience of spending a month getting used to an unfamiliar data tool.
Toucan's new table navigation features which include a user-friendly UI and collaboration capabilities such as annotations, comment sections, and instant reporting generation.
These features all act to cater to CFOs like John, who prefer to use tables over visualizations. We understand that not every CFO works effectively with visualizations, and a data visualization tool does a lot more than make your tables look and feel nicer.
The biggest proposition data visualization tools and dashboards offer for CFOs is data accuracy and availability. When generating reports on Excel or other dated tools, mistakes are bound to happen.
Data connectors are here to solve that problem. For example, Toucan is compatible with over 500 data warehouses and tools that seamlessly import data that updates your dashboard applications. This frees up decision-makers from the schedules of IT teams and provides instant access to accurate data in real-time.
Now that we've discussed the benefits of dashboards for the modern CFO, here are some examples of financial dashboards that would have turned ShipIt around.
CFO Dashboard Examples
Three CFO dashboard templates really stand out for the modern CFO who still prefers to use tables. Here are the three that we think finance decision-makers need:
Profit and Loss Dashboard
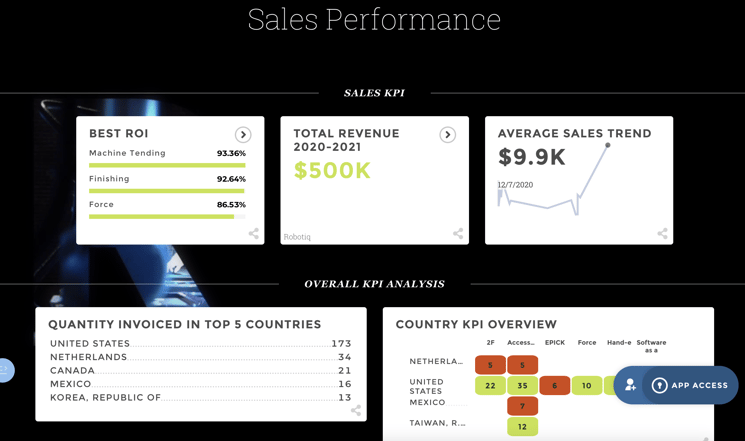
A profit and loss dashboard sounds deceivingly simple, when in fact, this dashboard is one of the more complex examples. Depending on your use case, this dashboard can include areas of your balance sheet, such as:
- Gross Sales
- Net Sales
- Cost of Goods Sold (COGS)
- Amortization Expense
- Operating Expenses
- Operating Income
- Net Profit
- Taxes
In this example, we also included a table about the breakdown of gross sales geographically, solving ShipIt's issue.
Financial Ratios Dashboard
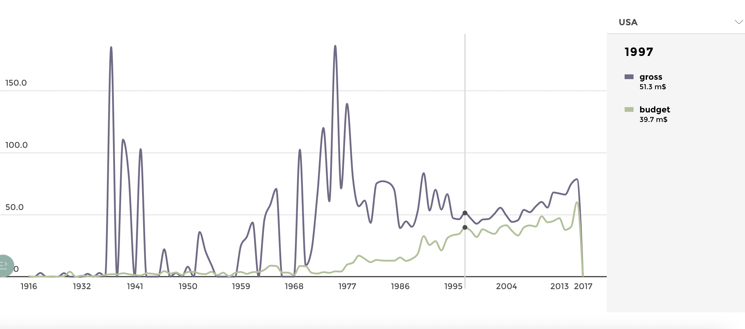
A comprehensive dashboard of financial ratios is the most useful tool for CFOs who prefer tables to visualizations. After all, these ratios are the focus of any successful CFO. In our example, we provided financial ratios such as:
- Current Ratio
- Quick Ratio
- Debt to Equity Ratio
Because tables allow CFOs to fit more data into a dashboard, they can select another few tables that include data on inventory, assets, net sales, net profit, and others that drill down the specifics of financial ratios.
CFO Cockpit Dashboard
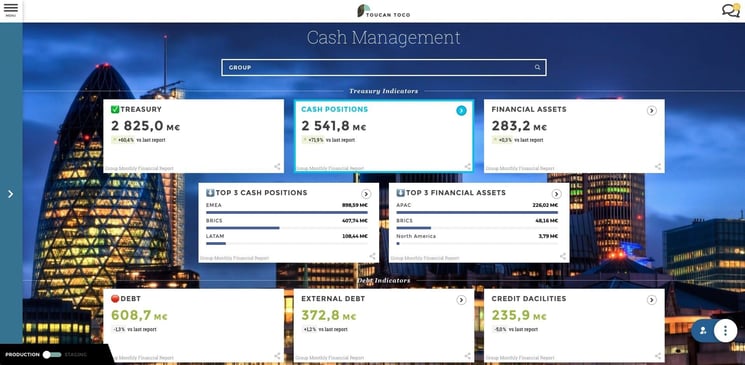
Sometimes, less is more. For the CFO who places a larger emphasis on specific metrics, a CFO dashboard with fewer KPIs allows decision-makers to view their most important KPIs with ease. In this example we included:
- EBIT
- Operating expenses
- Net income
- Gross Profit
- Revenue
- Employee Satisfaction
- Customer Satisfaction
By simplifying the snapshot of a business's financial health, CFOs can quickly view any weaknesses and know where to dig deeper for answers.
The CFO Dashboard Solution
Let's set John and ShipIt aside, CFOs in any industry or company size can introduce data visualization to make the best use of their data. Tracking metrics and ensuring that the business is financially healthy in all areas can drastically reduce the risk of default or capital mismanagement. Data visualization tools provide the best possible solution for tracking these figures and updating KPIs in real-time.
Toucan’s customer-facing analytics works to cater to specific use cases for several industries, carefully tailoring its applications to the requests and needs of a client. With rapid app deployment, Toucan’s real-time KPI tracking is extremely useful for businesses looking to keep constant tabs on financial health. Mobile optimization also caters to business owners on the move and simplifies complex data sets to tell a firm’s data story.
Embedded analytics to track finances is the way forward, with more CFOs adopting its perks to track crucial metrics.
.png?width=112&height=112&name=portrait_agathe_face%20(1).png)
