


Benefits of Embedded Analytics and Challenges
.png?width=88&height=88&name=portrait_agathe_face%20(1).png)
Agathe Huez
Publié le 11.07.23
Mis à jour le 13.01.26
6 min
Cloud-based embedded analytics refers to the integration of analytical algorithms in the cloud to analyze data on private or public infrastructures. This approach offers several key benefits: reduced infrastructure costs, improved user experience, real-time decision making, and data accessibility across the entire organization.
By combining scalable cloud computing with powerful analytics software, businesses can effectively detect patterns in their data and extract new actionable insights. Embedded analytics allows these capabilities to be integrated directly into existing applications, eliminating the need to switch between different software tools. This seamless integration facilitates user adoption and significantly improves business process efficiency.
Organizations of all sizes now use cloud-based embedded analytics to make data-driven decisions, create new revenue streams, consolidate their information, and optimize their supply chain. The cloud provides an indispensable platform for quickly experimenting with ideas through proofs of concept (POCs) and offers a rich ecosystem for application development and strategy testing.
What are the benefits of embedded analytics?
Software as a service (SaaS) is becoming the preferred method for modern analytics more than ever before. This shift is driven by the demand for data-driven agility, coupled with more distributed working practices, resulting in a move away from on-premise solutions. Future big data analytics will be based on cloud computing, enabling rapid innovation, collaborative analysis, and real-time data insights.
Here are key reasons why companies embed analytics into their business processes and move their data analysis to the cloud:
- Lower Costs and Faster ROI. Embedding analytics into your product using cloud-based solutions reduces the risk of making upfront hardware investments for on-premise servers. Additionally, you increase efficiency by eliminating the need to maintain servers and data warehouse infrastructure in-house, delivering faster time to market and improved ROI compared to traditional business intelligence approaches.
- Power Remote and Hybrid Work. Cloud-based embedded analytics solutions provide your distributed workforce, suppliers, and partners with instant, governed access to dashboards and data visualizations from anywhere on any device, including mobile. This accessibility ensures teams can make informed decisions regardless of location, enhancing overall productivity.
- Easy Collaboration. Leading embedded analytics platforms enable you to take snapshots of analytics, add commentary to provide improved context, and tag discussions. This creates a collaborative environment where technical and non-technical users can share insights in both real-time and asynchronous decision-making workflows.
- Up-to-Date Capabilities. Cloud data analytics solutions automatically update and upgrade without developer effort. This ensures your embedded analytics software continuously offers advanced capabilities and enhanced visualization options through seamless integration with your core applications.
- Flexible Performance and scalability. You can turn on and off cloud data analytics services as your data needs change rather than purchasing new hardware. When facing data spikes, you can quickly adjust service levels and scale back during periods of less activity, ensuring optimal performance without excessive costs.
- Reliability and Security. Data security risks are reduced in SaaS environments with embedded analytics. The likelihood of errors decreases when servers aren't manually configured, and reputable providers must meet stringent security standards and remain compliant to obtain certifications, helping to improve security for all end users.
- Centralized Data. It is difficult to gain a complete understanding of your business when your data is scattered and siloed across your CMS, ERP, marketing automation, and countless other systems. Cloud-based embedded analytics solutions consolidate this information, providing a unified interface that eliminates switching between standalone applications. This contextual analytics approach creates an intuitive user experience that feels natural within the host application, improving customer satisfaction and supporting data-driven decision making.
What types of businesses can benefit the most from embedded analytics?
Let's explore which organizations can extract maximum value from seamlessly integrating analytics into their everyday workflows!
SaaS and application providers: The natural fit
For Independent Software Vendors (ISVs) and SaaS companies, embedding analytics isn't just beneficial—it's becoming essential. By integrating interactive visualizations directly into their applications, these providers enhance user experience without requiring customers to leave their platforms. A CRM provider embedding sales performance dashboards directly within their Salesforce integration, for instance, can deliver real-time insights that drive revenue growth while saving users countless hours of context-switching.
Data-driven service industries: Making sense of volume
Healthcare organizations, financial institutions, and insurance companies deal with massive volumes of structured and unstructured data daily. By embedding analytics into patient portals, banking apps, or claims processing systems, these businesses can improve efficiency dramatically. Imagine a healthcare portal that doesn't just store patient records but presents trends and anomalies to physicians at the point of care—enabling more informed decisions exactly when they matter most.
E-commerce and retail: Understanding customer experience
Retailers who embed analytics into their operations gain a competitive edge by truly understanding customer behavior. By integrating purchase data, browsing patterns, and survey responses into accessible dashboards, marketing teams can quickly figure out what drives customer satisfaction. The ability to track product performance in real-time allows for rapid adjustments to inventory, pricing, and promotions that directly improve the bottom line.
Startups and scale-ups: A competitive advantage without heavy lifting
For growing businesses with limited developer resources, embedded analytics offers a compelling shortcut to sophisticated data capabilities. Rather than building analytics from scratch, startups can leverage third-party solutions with React SDK support to quickly embed powerful visualizations. This approach allows them to focus on their core product while still offering the data-driven insights that larger competitors provide.
Cloud analytics challenges: How to overcome them?
Transferring data analytics to the cloud would be much simpler if it were just a "lift and shift" operation. Moving applications and their data to the cloud without redesigning them is known as lift and shift. Since this approach isn't possible for cloud analytics, it's essential to prepare for the challenges you'll encounter.
These challenges shouldn't discourage you, however. Running data analytics in the cloud is a necessary step for gaining faster insights, making better decisions, innovating more effectively, increasing agility, and gaining a competitive advantage. Here are seven challenges to consider.
How to navigate an ever-evolving technology ecosystem?
Technology in this area is constantly evolving. A comparison of what is available today with what will be available in six months will reveal many changes. Currently, Snowflake and Amazon Redshift are the two most popular database technologies. However, there are a number of players in the data analytics market. For your needs to be met, you will need to find solutions that will last over time, and that work well together.How to make your data more flexible for the future?
You may find that your current data and analytics systems do not provide the level of flexibility and agility that your customers will require when they have access to these systems in the cloud. As your organization's requirements change over time, you will need to plan ways to make those systems more flexible.
Integrating multiple sources: a puzzle to solve?
Whether you are working on-premises or in the cloud, any application that requires data consolidation from multiple sources presents a challenge. For your product, customer, service, and supply data to be consistent, you may need a master data management strategy. In the event that a customer is listed as P. S. and Sons in one database and PS Sons in another, you’ve got a problem. In order to leverage analytics on top of the data, you will need to establish a solid foundation.
What skills to acquire for a successful cloud transition?
When you move your data analytics to the cloud, you will be utilizing new technologies. Depending on your needs, you may select Snowflake or Amazon Redshift, as well as additional AWS or Microsoft technologies. In order to make effective use of the new technologies, you will need to determine whether you have the skills in-house, or if they are available on the market. It will be necessary to develop a plan to acquire those skills and capabilities, either through internal training or external hiring.How to transform raw data into actionable insights?
It is not just about the technology when it comes to data analytics. The initiative must be driven from within the organization. Customers will ask you questions such as, “How can I become more innovative and efficient - how can I help the business grow? ” You’ll need to determine how to structure the data to answer those types of questions.
At what stage of analytical maturity is your company?
Depending on your organization's Business Intelligence (BI) maturity, you'll need to answer different questions. Your organization will progress through five stages of maturity and will require different tools at each stage:- Running the business: Reports that show what happened in the business.
- Measuring and monitoring the business: Reports that help measure performance and monitor what is happening in the business.
- Integrating performance management and the business: Reports that measure KPIs across the organization and give insight that will help the organization respond to what’s happening.
- Fostering innovation and people productivity: Using the cloud to deploy enterprise metrics and actively researching new methods and technologies.
- Creating market agility and differentiation: Using the cloud capabilities to drive innovation, define business strategies, and achieve transformation within the business.
Identify where your organization stands in terms of BI maturity and develop tools and processes that will assist the organization in moving forward.
Features of Cloud-based embedded Analytics Tools
These common features can boost your productivity and results when you shop for a cloud-based embedded analytics platform:
- Data Sources: Link the solution to one or multiple data sources with automatic refreshing to always have the latest results.
- Data Models: Look for solutions that include data models to match your company’s data sets, such as sales orders, customers, items, etc.
- Processing Applications: Work with your data and alter it to uncover unexpected insights, novel uses and patterns.
- Data Sharing: Easily share information between team members to optimize productivity and efficiency across the company.
- Analytics Models: Tap into prebuilt analytics models designed for different use cases, or build your own.
- Reporting: Create accurate, detailed reports that you can confidently bring to the C-suite, board of directors, lenders or investors.

How to choose the best cloud-based embedded analytics platform?
It may be new to your company, but cloud-based embedded analytics is a relatively mature field that continues to offer greater value and additional uses to businesses. As a result, you have several quality options to choose from, but not every cloud analytics platform is created equal.
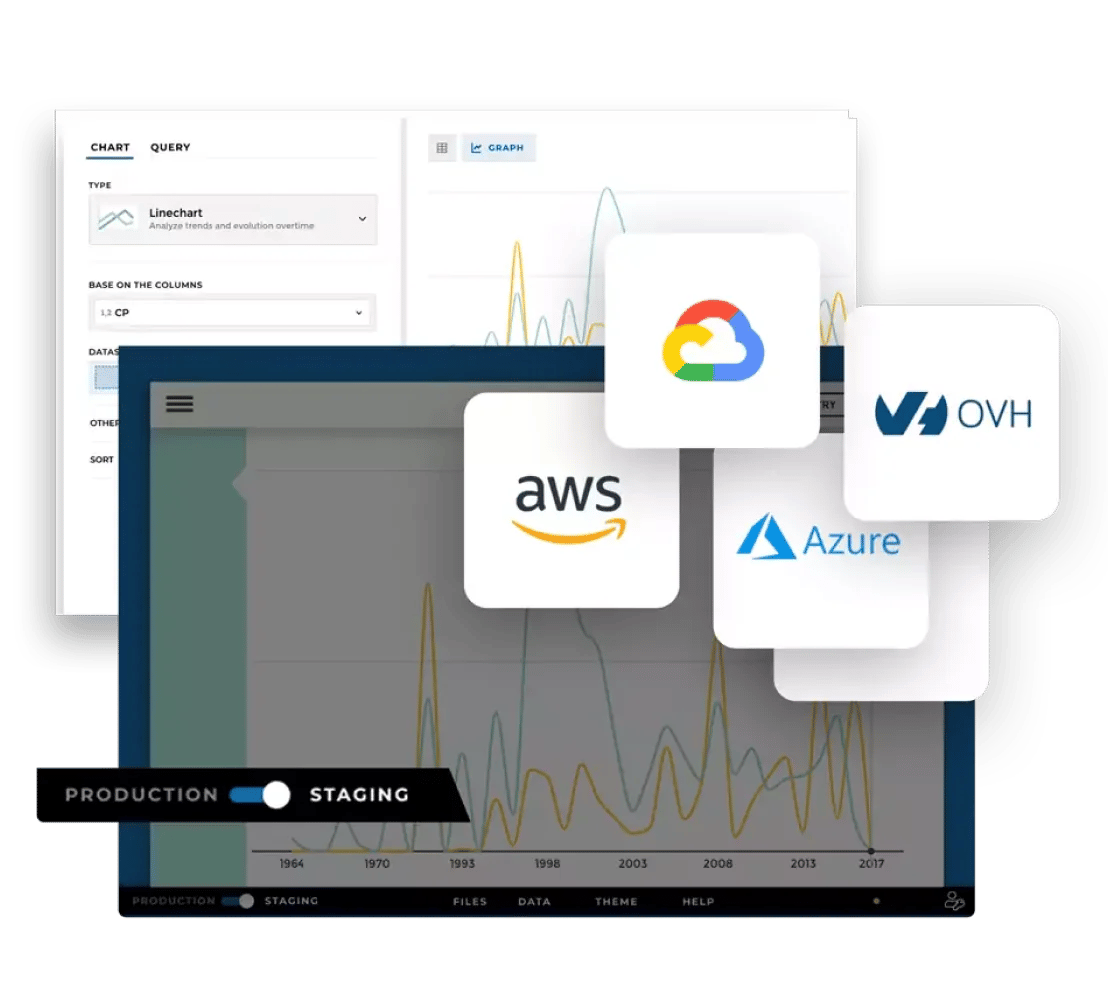
Toucan offers a cloud-based embedded analytics platform with deep reporting capabilities. In order to generate insights, Toucan can leverage all the information already stored on the cloud - such as financial information, inventory and orders, human resources, and sales and marketing information. Toucan easily integrates with all the major could data storage platforms to provide a seamless experience.
Toucan comes equipped with several features like searches and filters, standard and customized reports, and a workbook tool for generating charts and reports based on user-defined parameters. Take advantage of one of these demos to learn more about how Toucan can benefit your business.
The popularity of cloud-based embedded analytics is on the rise across all types of industries due to its accessibility, reliability, and the insights that can be gained from the data it provides. Cloud analytics may be the perfect solution for companies dealing with large amounts of data and with limited resources to process, manage, and analyze it.
.png?width=112&height=112&name=portrait_agathe_face%20(1).png)
