Back


Types of Dashboards: Operational, Analytic, and Strategic
Dashboards are vital to any businesses' operations, displaying relevant information for specific business users. There are many variations of dashboards, but all of them can generally be classified into one of these three groups:
- Operational
- Analytical
- Strategic
The Operational Dashboard
The operational dashboard is the most commonly used type of dashboard. This is the traditional dashboard, presenting real-time updated data on the day's operations. It is often found on the walls of plant production lines.
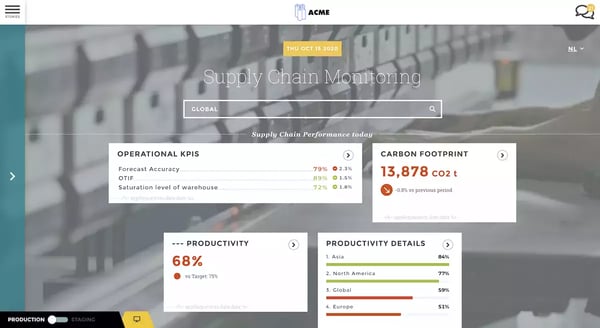
This dashboard is designed to provide a clear and instant view of the day's performance. It should provide an overview, without going into detail to preserve readability and efficiency. When designing the dashboard, it is important to choose the data to be displayed according to the audience for which it is intended. Operational dashboards commonly display:
- Time-to-decision or action
- Employee productivity
- Quality control
- Issue resolution times
The Analytical Dashboard
The analytical dashboard, on the other hand, allows you to analyze past data to identify trends and make decisions. Unlike the operational dashboard, it must be interactive to allow the user to explore the data and metrics in more detail. It incorporates features from both operational and strategic dashboards.
Data can be compared on different variables. By comparing the data over time, it is possible to check whether differences in performance are due to actions taken by the company or to external factors such as seasonality. In this way, it is possible to replicate successful efforts.
An analytical dashboard requires more expertise than an operational dashboard. The data is more complex, and the interactions require some knowledge. Therefore, they are intended more for data analysts supporting executive decisions and not for all employees in the organization.
The Strategic Dashboard
Finally, the strategic dashboard enables performance to be monitored using pre-defined Key Performance Indicators. Generally, this type of dashboard is used to measure the performance of the different departments of the company, such as:
- Sales
- Marketing
- Management
- Finances
Most often, strategic dashboards compare past performance data with that of the current period. They thus make it possible to check whether performance has increased, remained stable, or deteriorated.
These dashboards are composed of data from multiple sources since performance is impacted by many factors. The information highlighted is generally relevant to the entire company.