


The 10 best open data portals - Making data public
.png?width=88&height=88&name=portrait_agathe_face%20(1).png)
Agathe Huez
Publié le 21.04.21
Mis à jour le 13.01.26
4 min
Making public data available to the public: the core principle of open data is fundamental to transparent governance.
When public institutions implement policies, they must also inform voters about the impact of these actions. And the European Union is doing well on this front: the Open Data Maturity Report gives open data implementation strategies in the EU a score of 85% in 2019. Yet the impact of these policies only scored 72%.
The success of these communication initiatives greatly depends on how user friendly the platform is. Knowing how to communicate data through compelling stories is essential: more often than not, this can be achieved through portals that are visual, interactive and easy to use.
From Canada all the way to Australia, public institutions are sharing data to raise awareness, mobilize, and entertain their citizens through inspirational and richly informative data-sharing projects.
Some of them particularly caught our attention.
1. UNDER THE SEA…
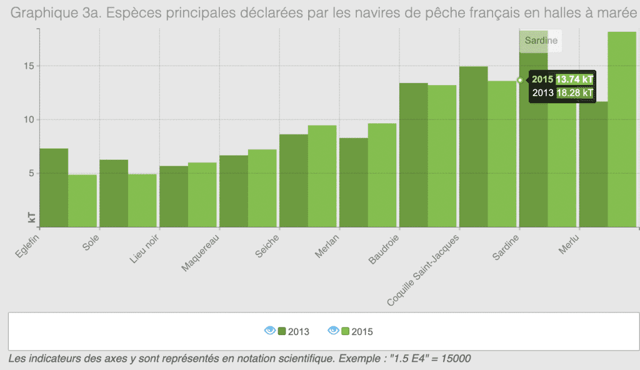
Ifremer is the French Research Institute for Exploitation of the Sea. Its missions include observing the status of the marine and maritime environment, an environment that provides an added value estimated at 30 million euros in 2013. Key data for the maritime economy (turnover, seafood production in kilotons, etc.) is displayed on the Ifremer online portal through interactive graphs and tables, and can be downloaded in CSV format.
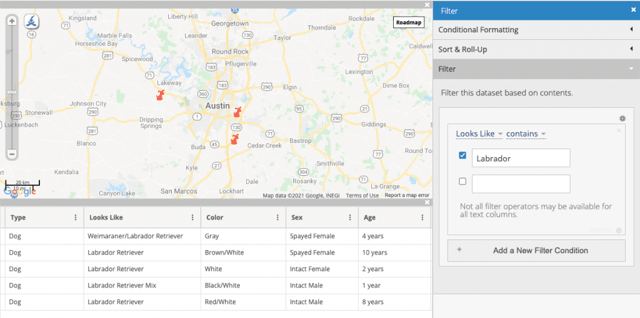
2. HELP! I’VE LOST MY DOG!
“Have you seen Goldie, our lost Labrador? Reward for his safe return!”
Could there be a better way to get your neighbors’ help in your search for a missing pet? The city of Austin, Texas, which has a talent for open data projects, has tackled this question. Their answer is a portal sharing details about all the cats and dogs that have been lost or found on the city’s streets. The data can be filtered by breed, sex, or appearance, to maximize your chances of finding your four-legged friend. Here’s what the search for our lost Labrador would look like:
3. HOW IS THE CORONAVIRUS SITUATION DEVELOPING?
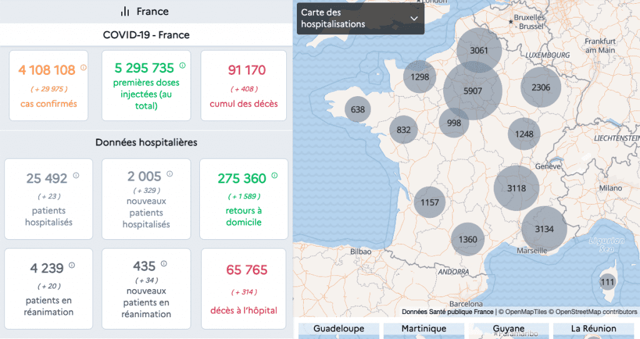
Reliable data is even more important in times of crisis. Given the abundance of misleading information, fake news and conspiracy theories, it is vital to put clear and relevant data out there. This is the objective of the COVID-19 government portal that compiles the number of confirmed cases in France, provides an update on the progress of the vaccination campaign and shows the number of deaths. An interactive map lets users view the different indicators by departements (counties).
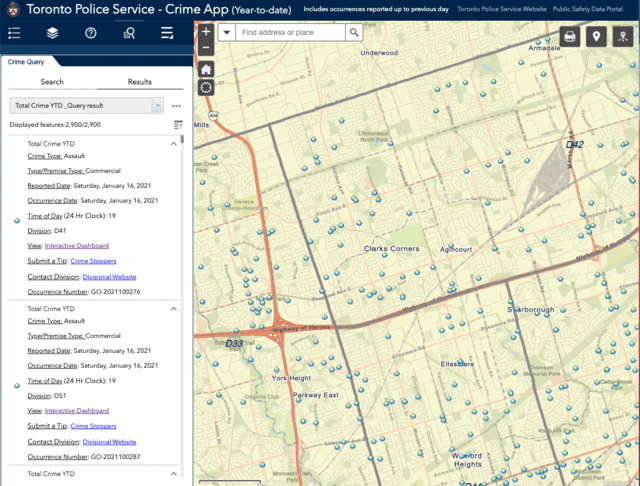
4. WHAT NEIGHBORHOODS ARE THE MOST CRIME-RIDDEN?
To provide communities with information about public safety and awareness, the Toronto Police Service in Canada provides transparent data about the incidence of violent crime. Users can view the types of crimes committed by neighborhood for the year to date on an interactive map. Citizens are thus given real time information about the work of the police.
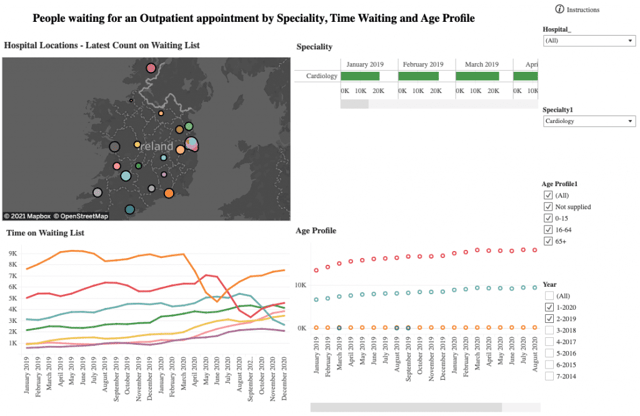
5. HOW LONG WOULD YOU HAVE TO WAIT TO SEE A DOCTOR?
Quick access to care is a key issue for public health. In order to give the general public and health care professionals information about patient waiting times, the Irish government has provided its citizens with an interactive portal where they can view the length of waiting lists by type of illness, operation or patient age. Citizens can monitor the status by
region and branch of medicine, using an extremely granular filtering system. Here is an example for cardiology visits:
6. AWARENESS OF SUICIDE RISK

Monitoring suicide rates in Australia throughout the 20th century has shown that periods of economic crisis greatly influence the mental health of the population. It is possible to build a sociodemographic profile of individuals who are most at risk. These predictive factors are highlighted in the Australian Suicide & Self-Harm Monitoring portal to promote better care of individuals who are suffering severe psychological distress.
7. HOW MANY SQUIRRELS ARE THERE IN CENTRAL PARK?
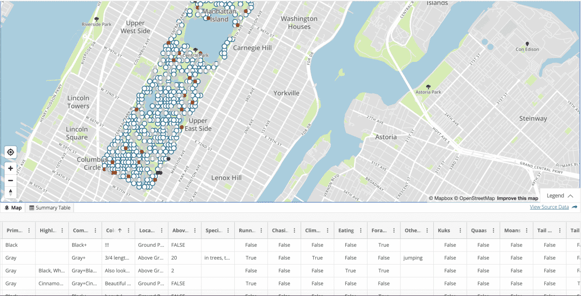
Open data is a serious subject, but it can be fun too. The city of New York knew this when it dedicated a data portal to the extremely accurate headcount of squirrels spotted in the city. It delivers a fail-proof scientific way of categorizing these rodents according to the color of their fur, their activity (whether they were spotted eating, climbing, digging, etc.) and even their reaction to their human observers.
8. DISPLAY THE OUTCOMES OF A RECOVERY PLAN
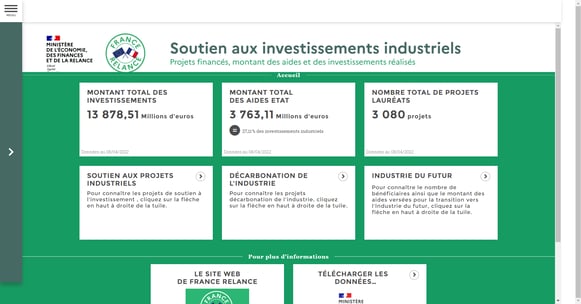
When a recovery plan is launched to deal with a crisis, it is important to show citizens the result of the measures that have been implemented. The Ministry of the Economy, Finance and Recovery asked Toucan Toco for assistance with the data visualization of the impact of their policy. The result is a clear and dynamic portal where you can measure progress made in two key areas: manufacturing and decarbonization. The platform offers a granular view by region (state), departement (county), and type of business. This informative project was key for building citizens’ confidence.
OUR DATA VISUALIZATION SOLUTIONS
9. PUBLIC SPENDING REPORT
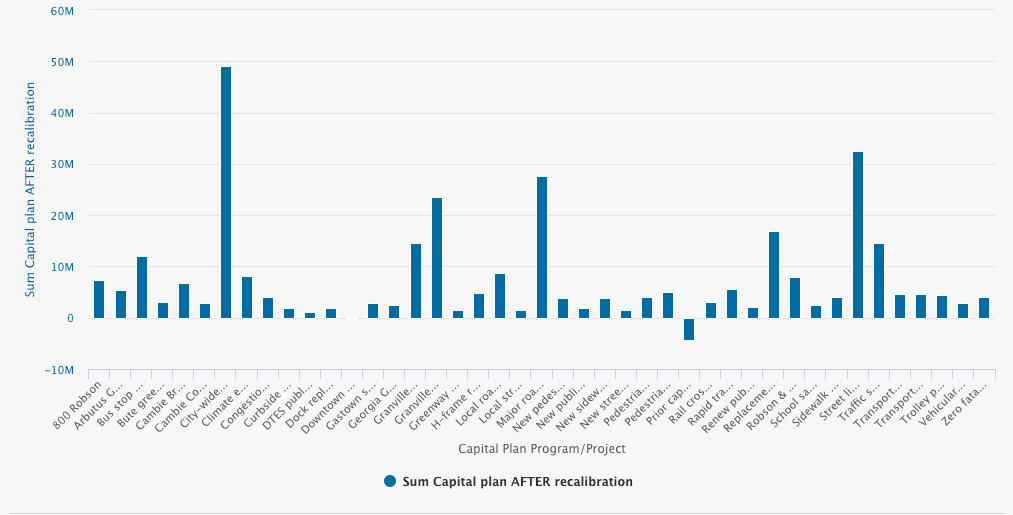
“Where do our taxes go?” Government bodies try to answer this question as transparently as possible to demonstrate the efficiency of their public policies. The city of Vancouver has successfully risen to the challenge via an accurate portal that details the council’s budget and expenses.
10. WHAT ARE THE MOST POLLUTING INDUSTRIES?
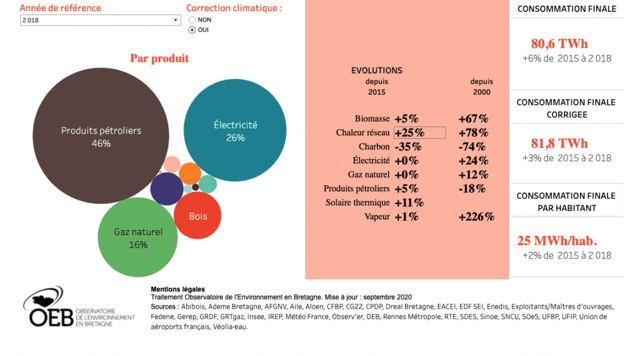
The ecological transition is the big challenge of the century. If we want to face it successfully, we can’t do without the help of data. Using data, for example, to analyze the products and activities that consume the most energy can help us make the necessary adjustments. This is exactly what the French Region of Brittany is hoping to do with its portal which compiles energy consumption by product, sector and resource.
Your most critical information deserves to be presented clearly. At Toucan Toco, we believe in the importance of open data.
Our mission is to equip novice users with ways to transform complex raw data into Dataviz and interactive storytelling. How may we help you?
.png?width=112&height=112&name=portrait_agathe_face%20(1).png)
