What Claude Dashboards means for business teams (and what it leaves to you)

Alim Goulamhoussen
Publié le 12.10.26
6 min
TL;DR
- Claude Dashboards, launched in beta in October 2026, turns a plain-English question into a live dashboard on top of your warehouse or CRM.
- Anthropic named a real problem: business teams wait for their numbers, or give up.
- It solves the interface. Anthropic itself scopes it for exploration, next to your BI tools.
- The work behind a trusted number did not go away: clean data, one definition per metric, the right rows for the right people, and a sign-off.
- Our take: the bottleneck moved from building dashboards to owning the numbers.
Anthropic just shipped a dashboard builder inside Claude.
If you run a team that waits on data, that is good news. It is also worth reading closely. The launch says as much about what it leaves out as about what it does.
What is Claude Dashboards?
Claude Dashboards is a Claude feature, launched in beta by Anthropic on October 8, 2026, that turns a question about your company's data into a live dashboard. You connect a data platform such as BigQuery, Snowflake, Databricks, Redshift or ClickHouse, or a tool like Salesforce. Then you ask in plain English, for example how this week's signups compare with last month's.
Claude queries the data, builds the dashboard and keeps it current as the data changes. You can click any number to see the query behind it, and each chart shows when it was last refreshed.
Dashboards can be shared with your team and, if your admin allows it, with people outside your organization. The feature is available on paid Claude plans. On Enterprise plans, it stays off until an admin turns it on.
What problem did Anthropic just name?
Read the launch announcement and the first thing you notice is the problem statement.
Anthropic writes that getting answers from company data usually means filing a ticket or writing SQL. So people wait. Or they skip the question.
That is not a feature pitch. It is a category description.
Business teams sitting on data they cannot use is now officially a problem big enough for an AI lab to build for. It is the same problem behind every analyst hire, every BI project that stalled and every spreadsheet someone rebuilds on Monday morning.
What does Claude Dashboards actually solve?
A lot. Let's be fair about it.
- Speed. From question to dashboard in minutes. No ticket, no queue.
- Access. No SQL. Anyone who can describe the question can get the chart.
- Freshness. The dashboard stays current instead of freezing on the day it was built.
- Transparency. The query behind each number is one click away.
For a curious manager with clean data, that is a big step. Go try it.
How does Anthropic scope it?
The most useful part of the announcement is how carefully it is scoped. Three choices stand out.
- Exploration first. Dashboards are presented as working well for "quick, exploratory questions."
- A first version. Claude makes the first version. You decide what gets shared.
- Next to BI. When a question needs deeper analysis, you send the dashboard to a BI or analytics tool and continue there.
That is an honest frame, and a smart one. Anthropic is not selling a reporting system. It is selling a fast way to explore.
What does that scope tell a business leader?
If you have a data team and a BI stack, Claude Dashboards slots in on top. Your analysts own the definitions. Claude speeds up the questions.
If you don't, read the scope again. Deeper analysis goes to a BI tool. The first version needs someone to decide what gets shared. With no data team, that someone is you.
Not sure which side you are on? Compare Claude Dashboards and a managed analytics service, side by side.
What does the launch leave to you?
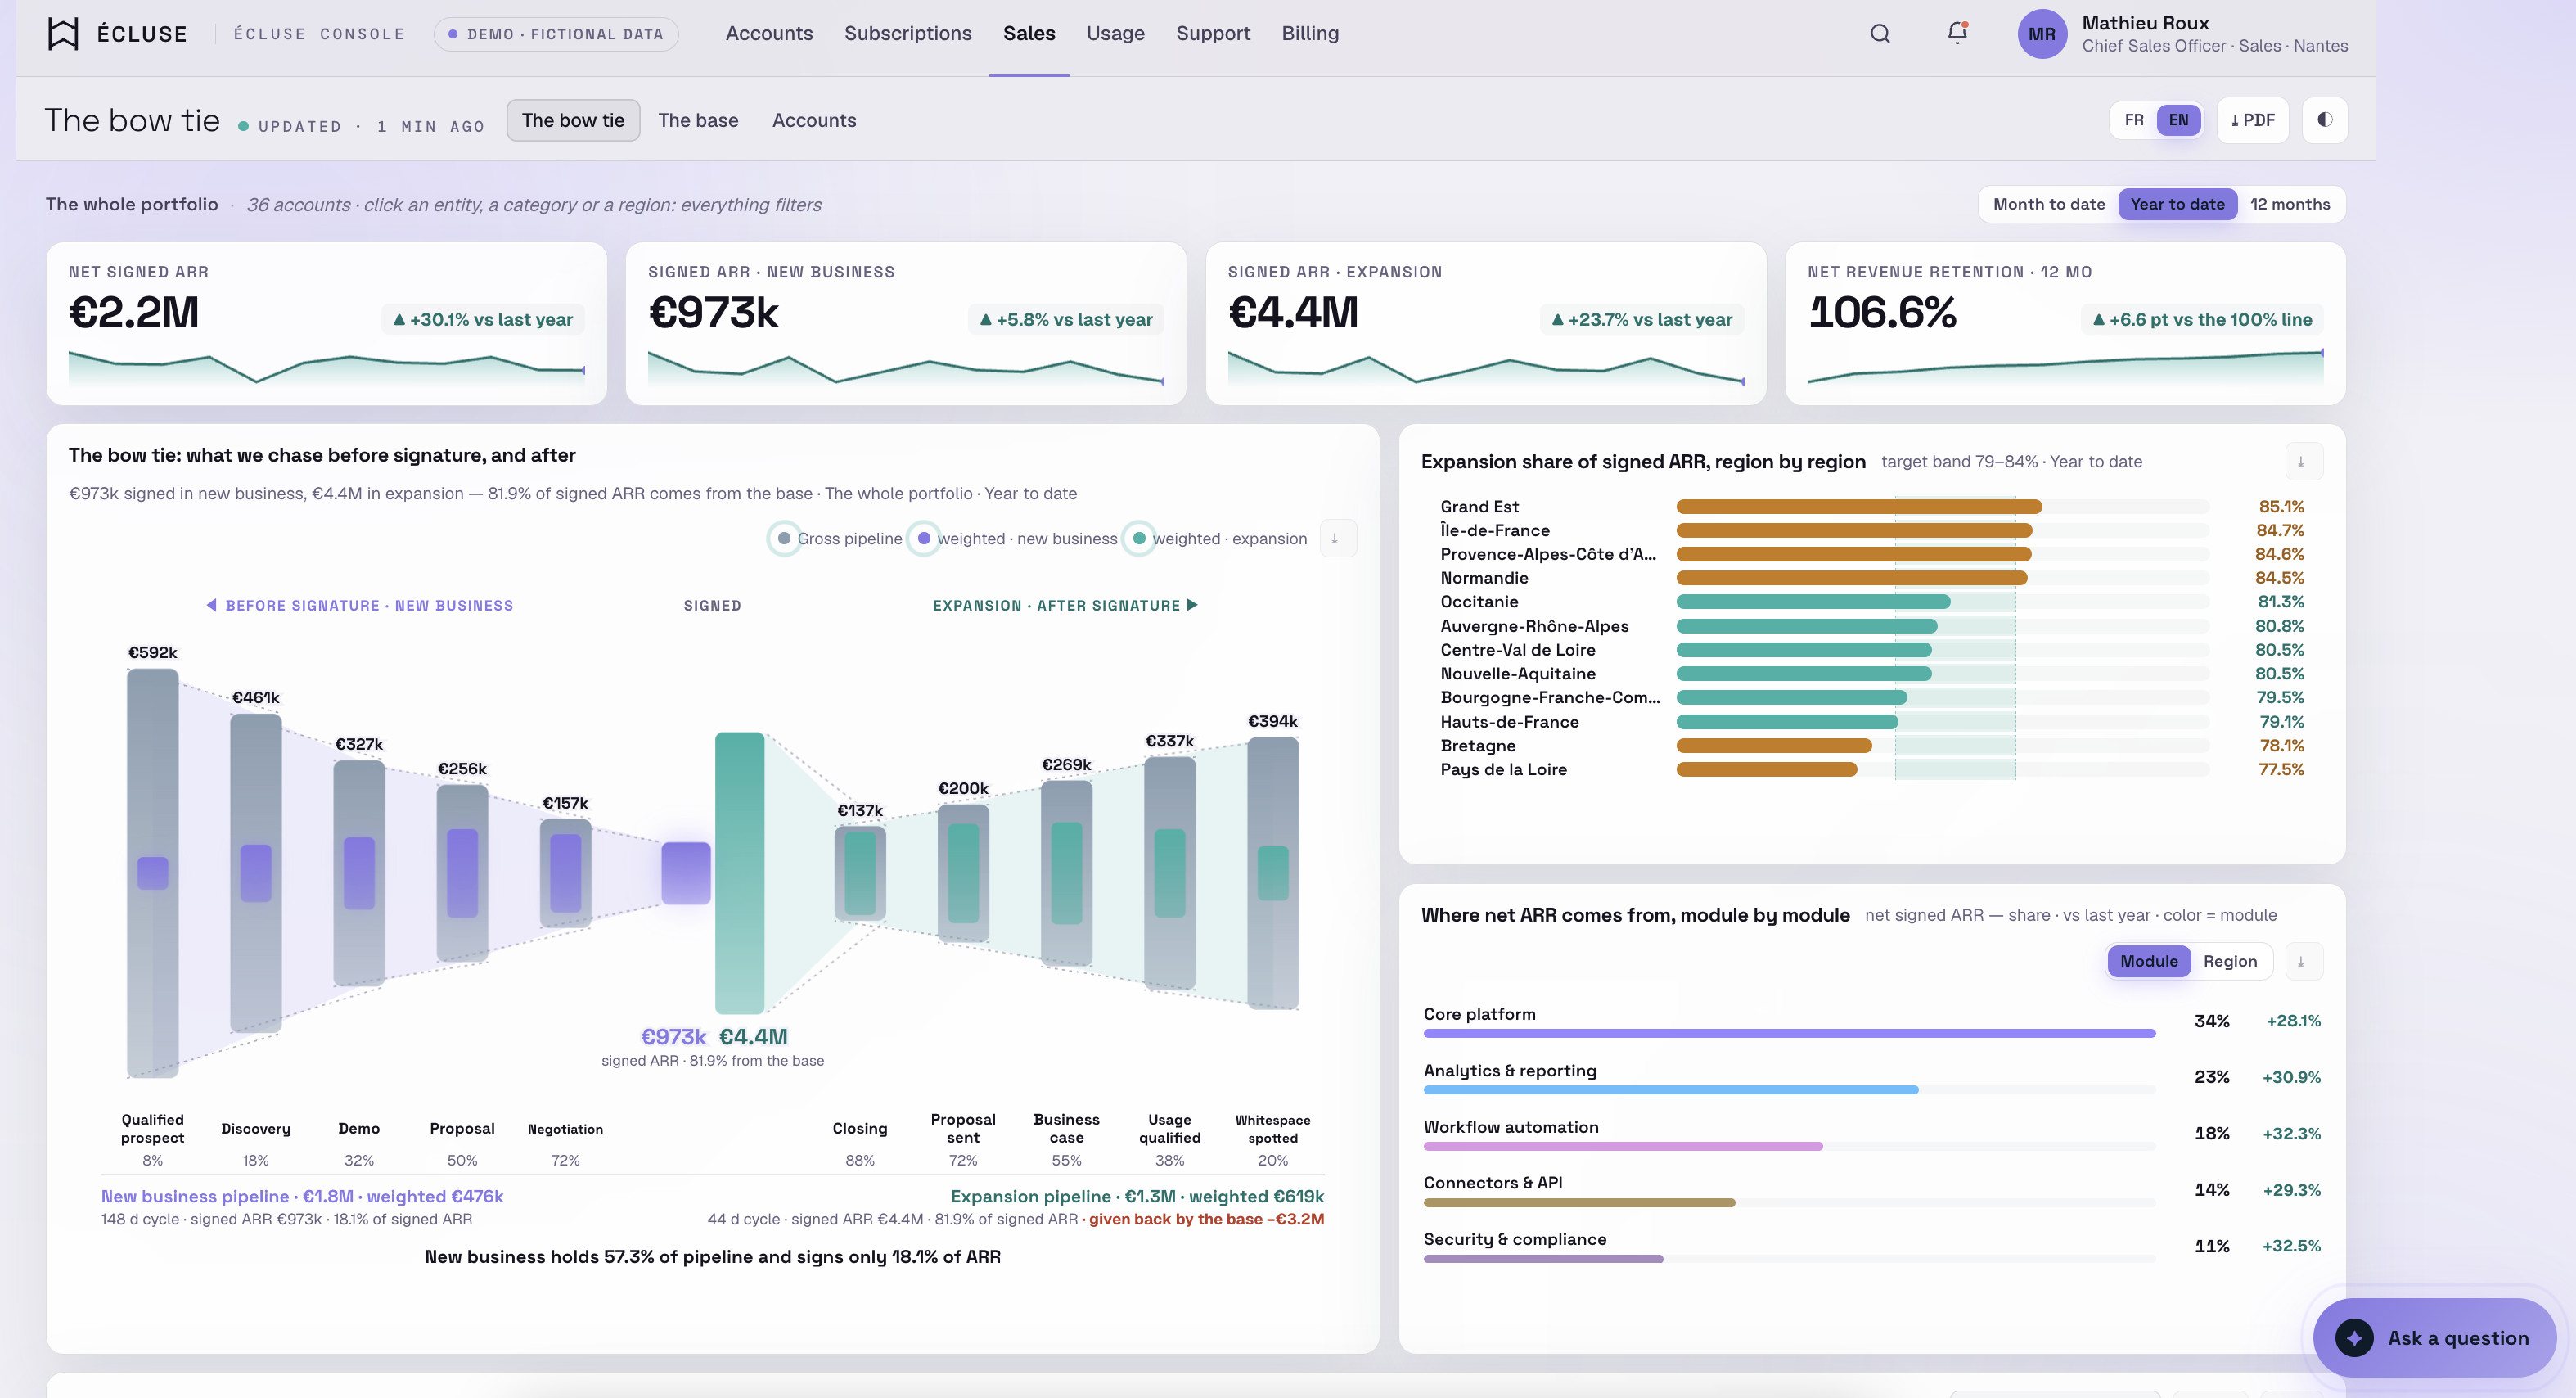
The interface got easier. The work behind a number you can trust stayed where it was. Four pieces, in plain terms.
1. Is your data clean enough?
Claude reads your warehouse as it is. Duplicated customers, three versions of "region", a table nobody has touched since 2022: the dashboard will be fast. And wrong.
Modeling, deduplicating and reconciling your sources is still a project. It does not happen because the interface got better.
2. Does everyone mean the same thing?
Ask "what's our revenue?" Finance means invoiced. Sales means booked. Ops means shipped.
A dashboard built from a question picks one. A semantic layer makes sure everyone gets the same one, every time. Without it, ten people asking the same question can get ten numbers.
3. Can you trace it, or only read it?
Seeing the query behind a number is real progress. It is visibility.
But a CFO does not review SQL. Traceability means someone checked the business rule and put their name on the number. Not that someone could.
4. Who sees which rows?
Sharing is now easy, inside or outside the company. So the hard question moves. Once a link travels, what does each reader see?
A regional manager should see their region. A client should see their own account. That rule has to live somewhere, and someone has to test it.
Planning to move your reporting to Claude? Run through the full checklist in Switching your analytics to Claude + MCP? Read this first.
So what really changes for a business team?
Our read: the bottleneck moved.
For years, the hard part of analytics for a business team was building. Getting a dashboard made at all. Claude Dashboards makes building close to free: a question, a minute, a chart.
That shifts the scarce part somewhere else. When anyone can build a dashboard, the scarce thing is a number everyone trusts. Prepared data, one definition, the right rows for the right people, and a person who signs off.
That work does not shrink when building gets faster. It grows, because there are more dashboards to keep consistent.
So the question for a business leader is no longer "who can build our dashboards?" It is "who owns our numbers?"
There are three answers. An in-house data team. A data analyst you hire. Or a managed analytics service that runs it for you.
Where does Toucan AI Crew fit?
We build for the second half of that question.
Toucan AI Crew is a managed analytics service: five AI agents and a Toucan expert who build, check and run your custom data app.
- The AI agents prepare your data, write one certified definition per metric and set row-level security.
- A Toucan Lead signs every release.
- Your first result arrives 48 hours after kickoff, then a release every week.
See how the Crew works, or browse live apps in our showcase.
Deciding between the two? Read Claude Dashboards vs a managed analytics service: which one fits? Weighing a Claude-built app more broadly? See Build a data app with Claude, or have it run for you?
Our take
Claude Dashboards is good news for business teams. It proves the problem is real, and it makes exploring your data nearly free.
It does not make anyone own the number. That part is still a job.
The only question is who does it.
FAQ
What is Claude Dashboards?
Claude Dashboards is a beta feature Anthropic launched in October 2026. It connects Claude to a data platform or CRM, turns a plain-English question into a live dashboard and keeps it current. Each number shows the query behind it.
Who can use Claude Dashboards?
It is in beta on paid Claude plans. On Enterprise plans, an admin has to turn it on in the organization settings first.
Does Claude Dashboards replace a BI tool?
No, and Anthropic does not position it that way. It is built for quick exploration and works alongside BI and analytics tools, where deeper analysis continues.
Do I need clean data to use Claude Dashboards?
Yes. Claude builds from the tables you connect. If they contain duplicates or conflicting definitions, the dashboard will reflect them. Preparing and modeling the data is still separate work.
Can I use Claude Dashboards without a data team?
For exploring questions, yes. For numbers a team shares and decides on, you still need someone to prepare the data, define each metric, set access rules and sign off. That can be a hire or a managed analytics service like Toucan AI Crew.