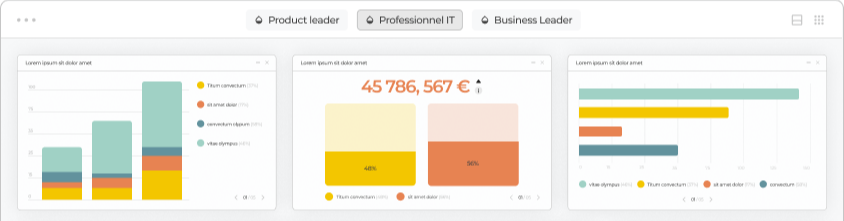
Most companies already have dashboards. A BI license, a few reports someone built two years ago, a weekly export that ends up in a spreadsheet.
And yet the Monday meeting still opens with the same question: which number is right?
That gap is where the term custom data app comes in. It gets used for very different things, from a Python script to an internal tool with forms and approvals. This guide defines it for a business reader: what a custom data app is, how it differs from a dashboard, when you need one, and who can build it and keep it running for you.
TL;DR
A custom data app is an application built on your data around the decisions of one team, with views shaped to your business, one definition per metric, and permissions per person. A dashboard shows numbers. A data app is where a team runs part of the business, and it keeps changing as the business does.
- A dashboard is a view. A data app is a product your team works in every day.
- Building it is now the easy part. Running, governing and changing it every week is the real job.
- If you do not want to build or hire for that job, a managed analytics service builds the app and keeps it running.
What is a custom data app?
A custom data app is an application built on your own data around the decisions a specific team makes. It brings together three things a standard dashboard rarely combines: views designed for how that team works, a governed layer where each metric has a single definition, and permissions that decide who sees which rows of data.
It is opened every day, not once a month. And it changes when the business changes: a new product line, a new region, a new question from the board.
Both words matter. Custom means the app follows your KPIs, your vocabulary and your way of deciding, including visualizations a standard chart library does not offer. App means it is deployed, it has users and access rules, and someone is responsible for keeping it working. That is the line between a data app and a file with charts in it.
Not the developer meaning. In engineering circles, "data app" often means an app a developer codes in Python with a framework like Streamlit. That is one way to build one. This article is about the business meaning: what you get and use, not how it is coded.
How is a custom data app different from a dashboard?
A dashboard answers "what happened?" for whoever opens it. A custom data app is built so one team can decide and act on trusted numbers, every day, with the view and the data that are theirs.
The difference shows up less in the charts than in everything around them.
| Dashboard in a BI tool | Custom data app | |
|---|---|---|
| Built around | The data available | The decisions a team makes |
| Visuals | The tool's chart library | Views designed for your business, bespoke when needed |
| Metric definitions | Often redefined report by report | One definition per metric, used everywhere |
| Permissions | Per dashboard, or by making copies | Per person, down to the row |
| Usage | Opened for a meeting, then exported | Used daily as the team's place to work |
| How it changes | A ticket to whoever built it | Continuously, as questions change |
| Who runs it | Whoever has time | Someone named and accountable |
None of this makes BI tools the problem. Power BI, Tableau or Looker can power excellent apps. The gap is rarely the software. It is that nobody on your side has the time to build, run and govern what the software makes possible.
Is a custom data app the same as an internal tool?
No. They are close cousins with different jobs.
- An internal tool is workflow-first. Forms, approvals, updating records in your CRM or ERP. Platforms like Retool are built for that.
- A custom data app is decision-first. It helps a team see, compare and act on numbers they trust.
If your main need is to enter and update records, an internal tools builder is the better fit. If your main need is trusted numbers that drive decisions, you want a data app.
What does a custom data app look like in practice?
A few illustrative examples, by team. They show the shape of the thing, not client cases.
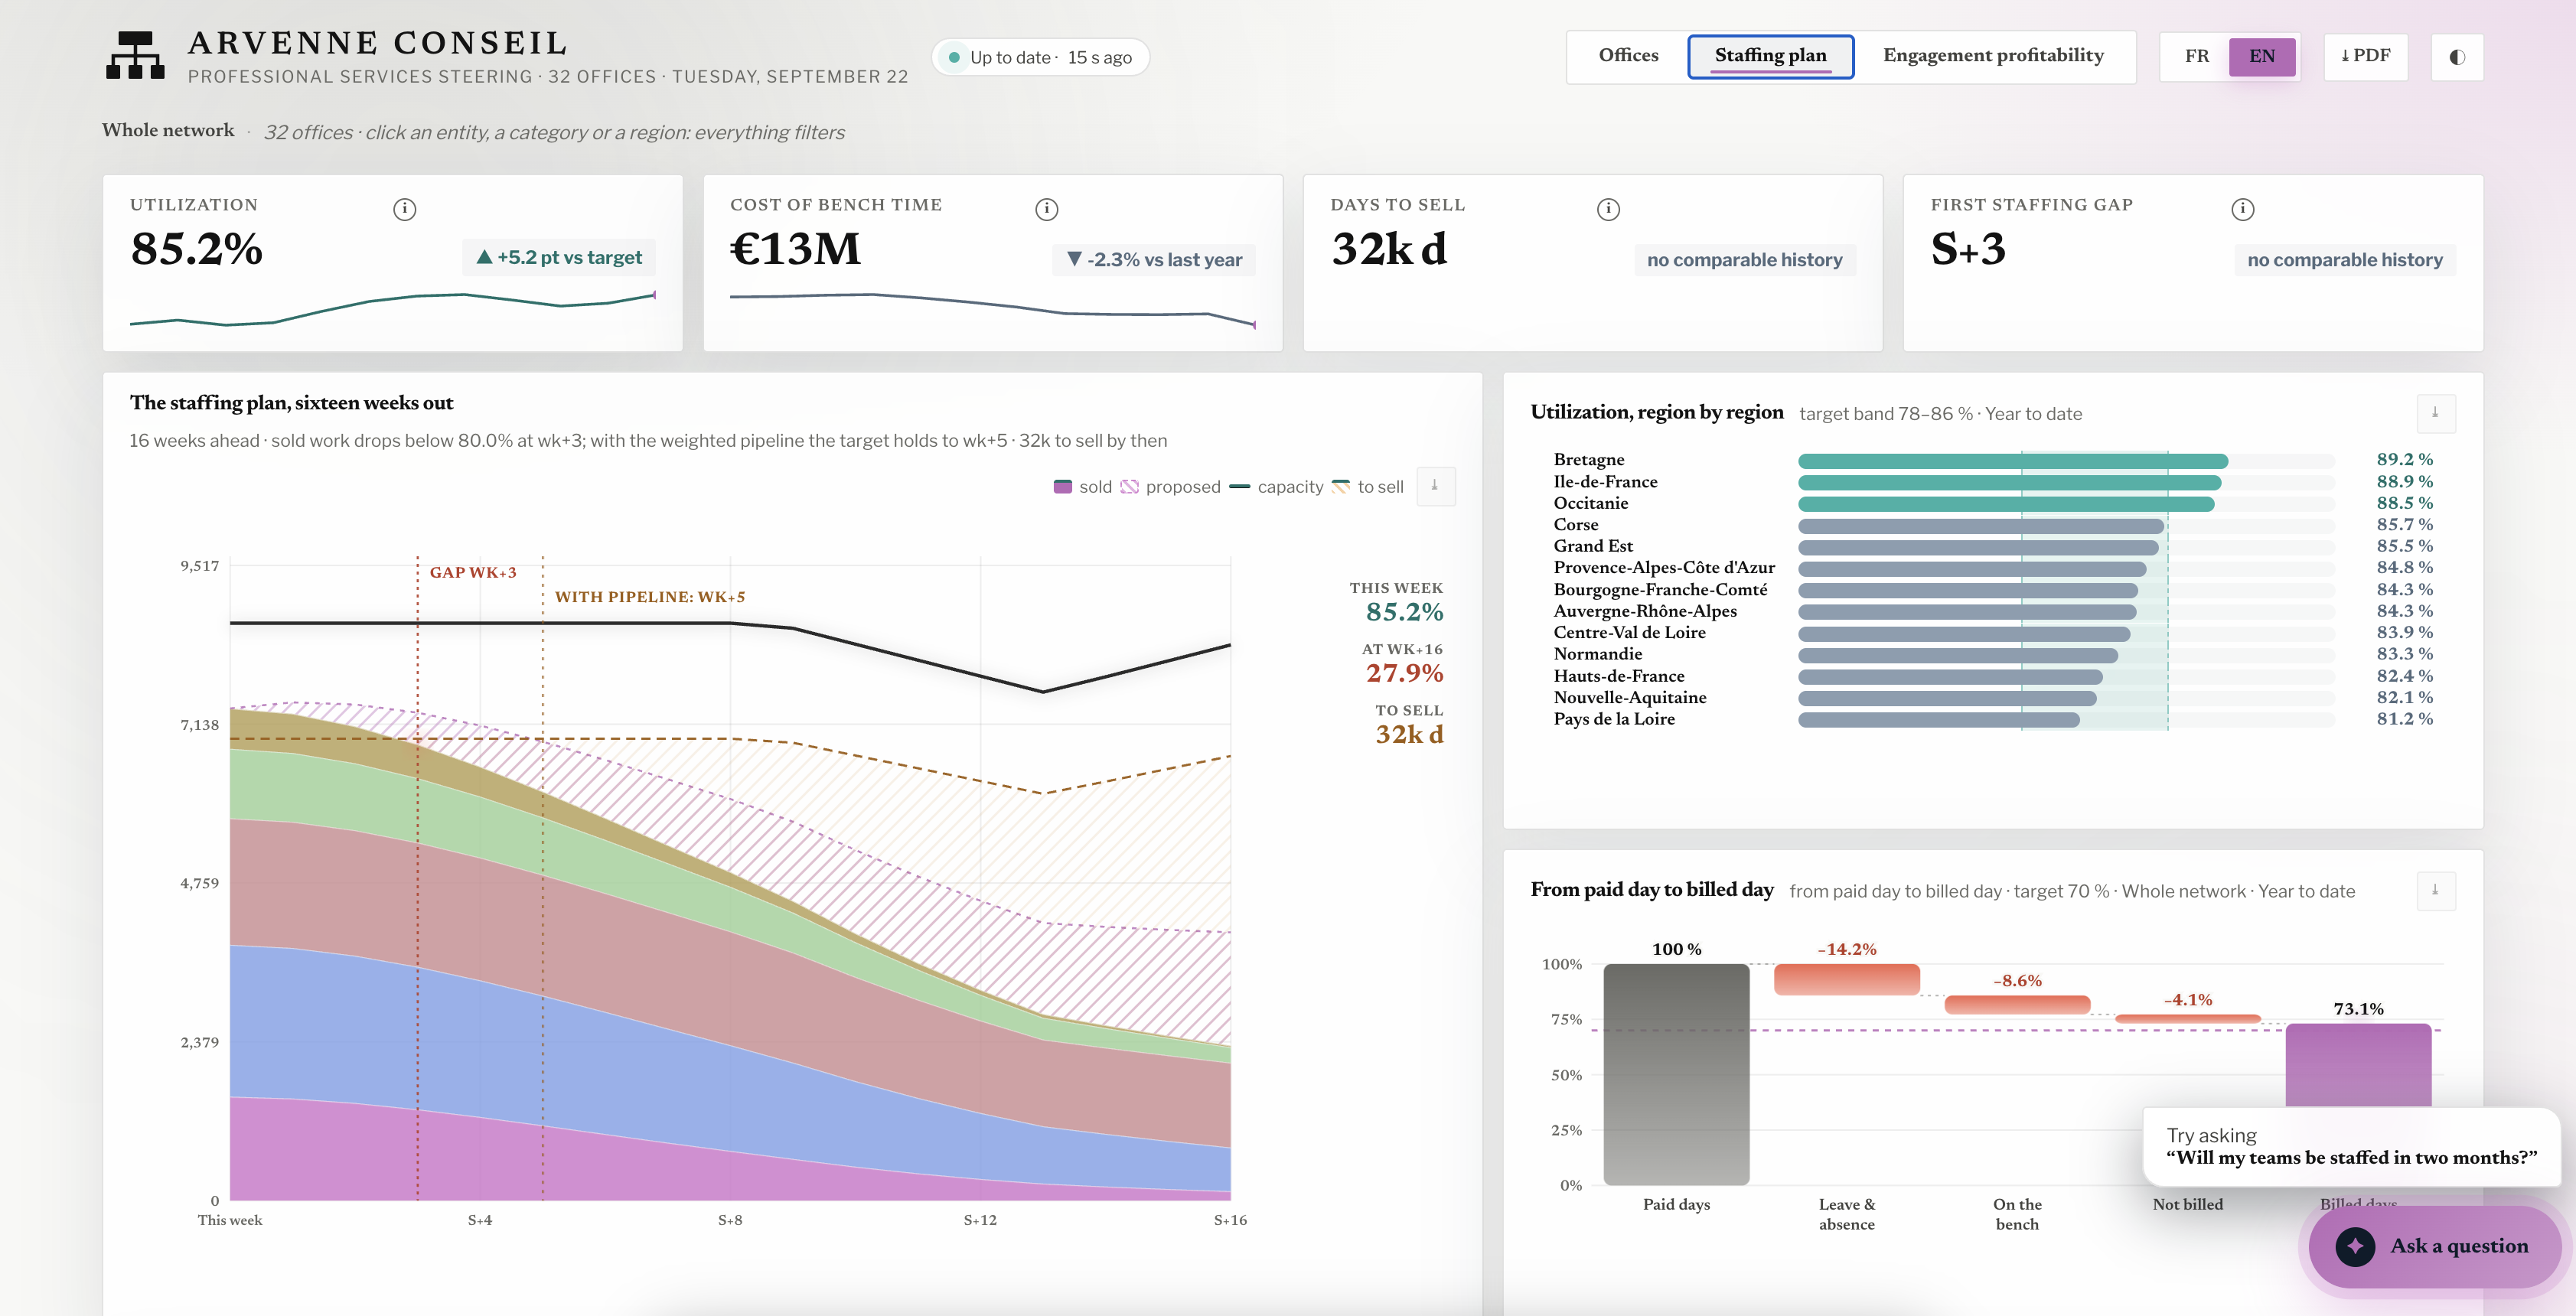
- Finance. Margin by product and by customer, cash position against forecast. The board view and the operating view come from the same definitions, so they never disagree.
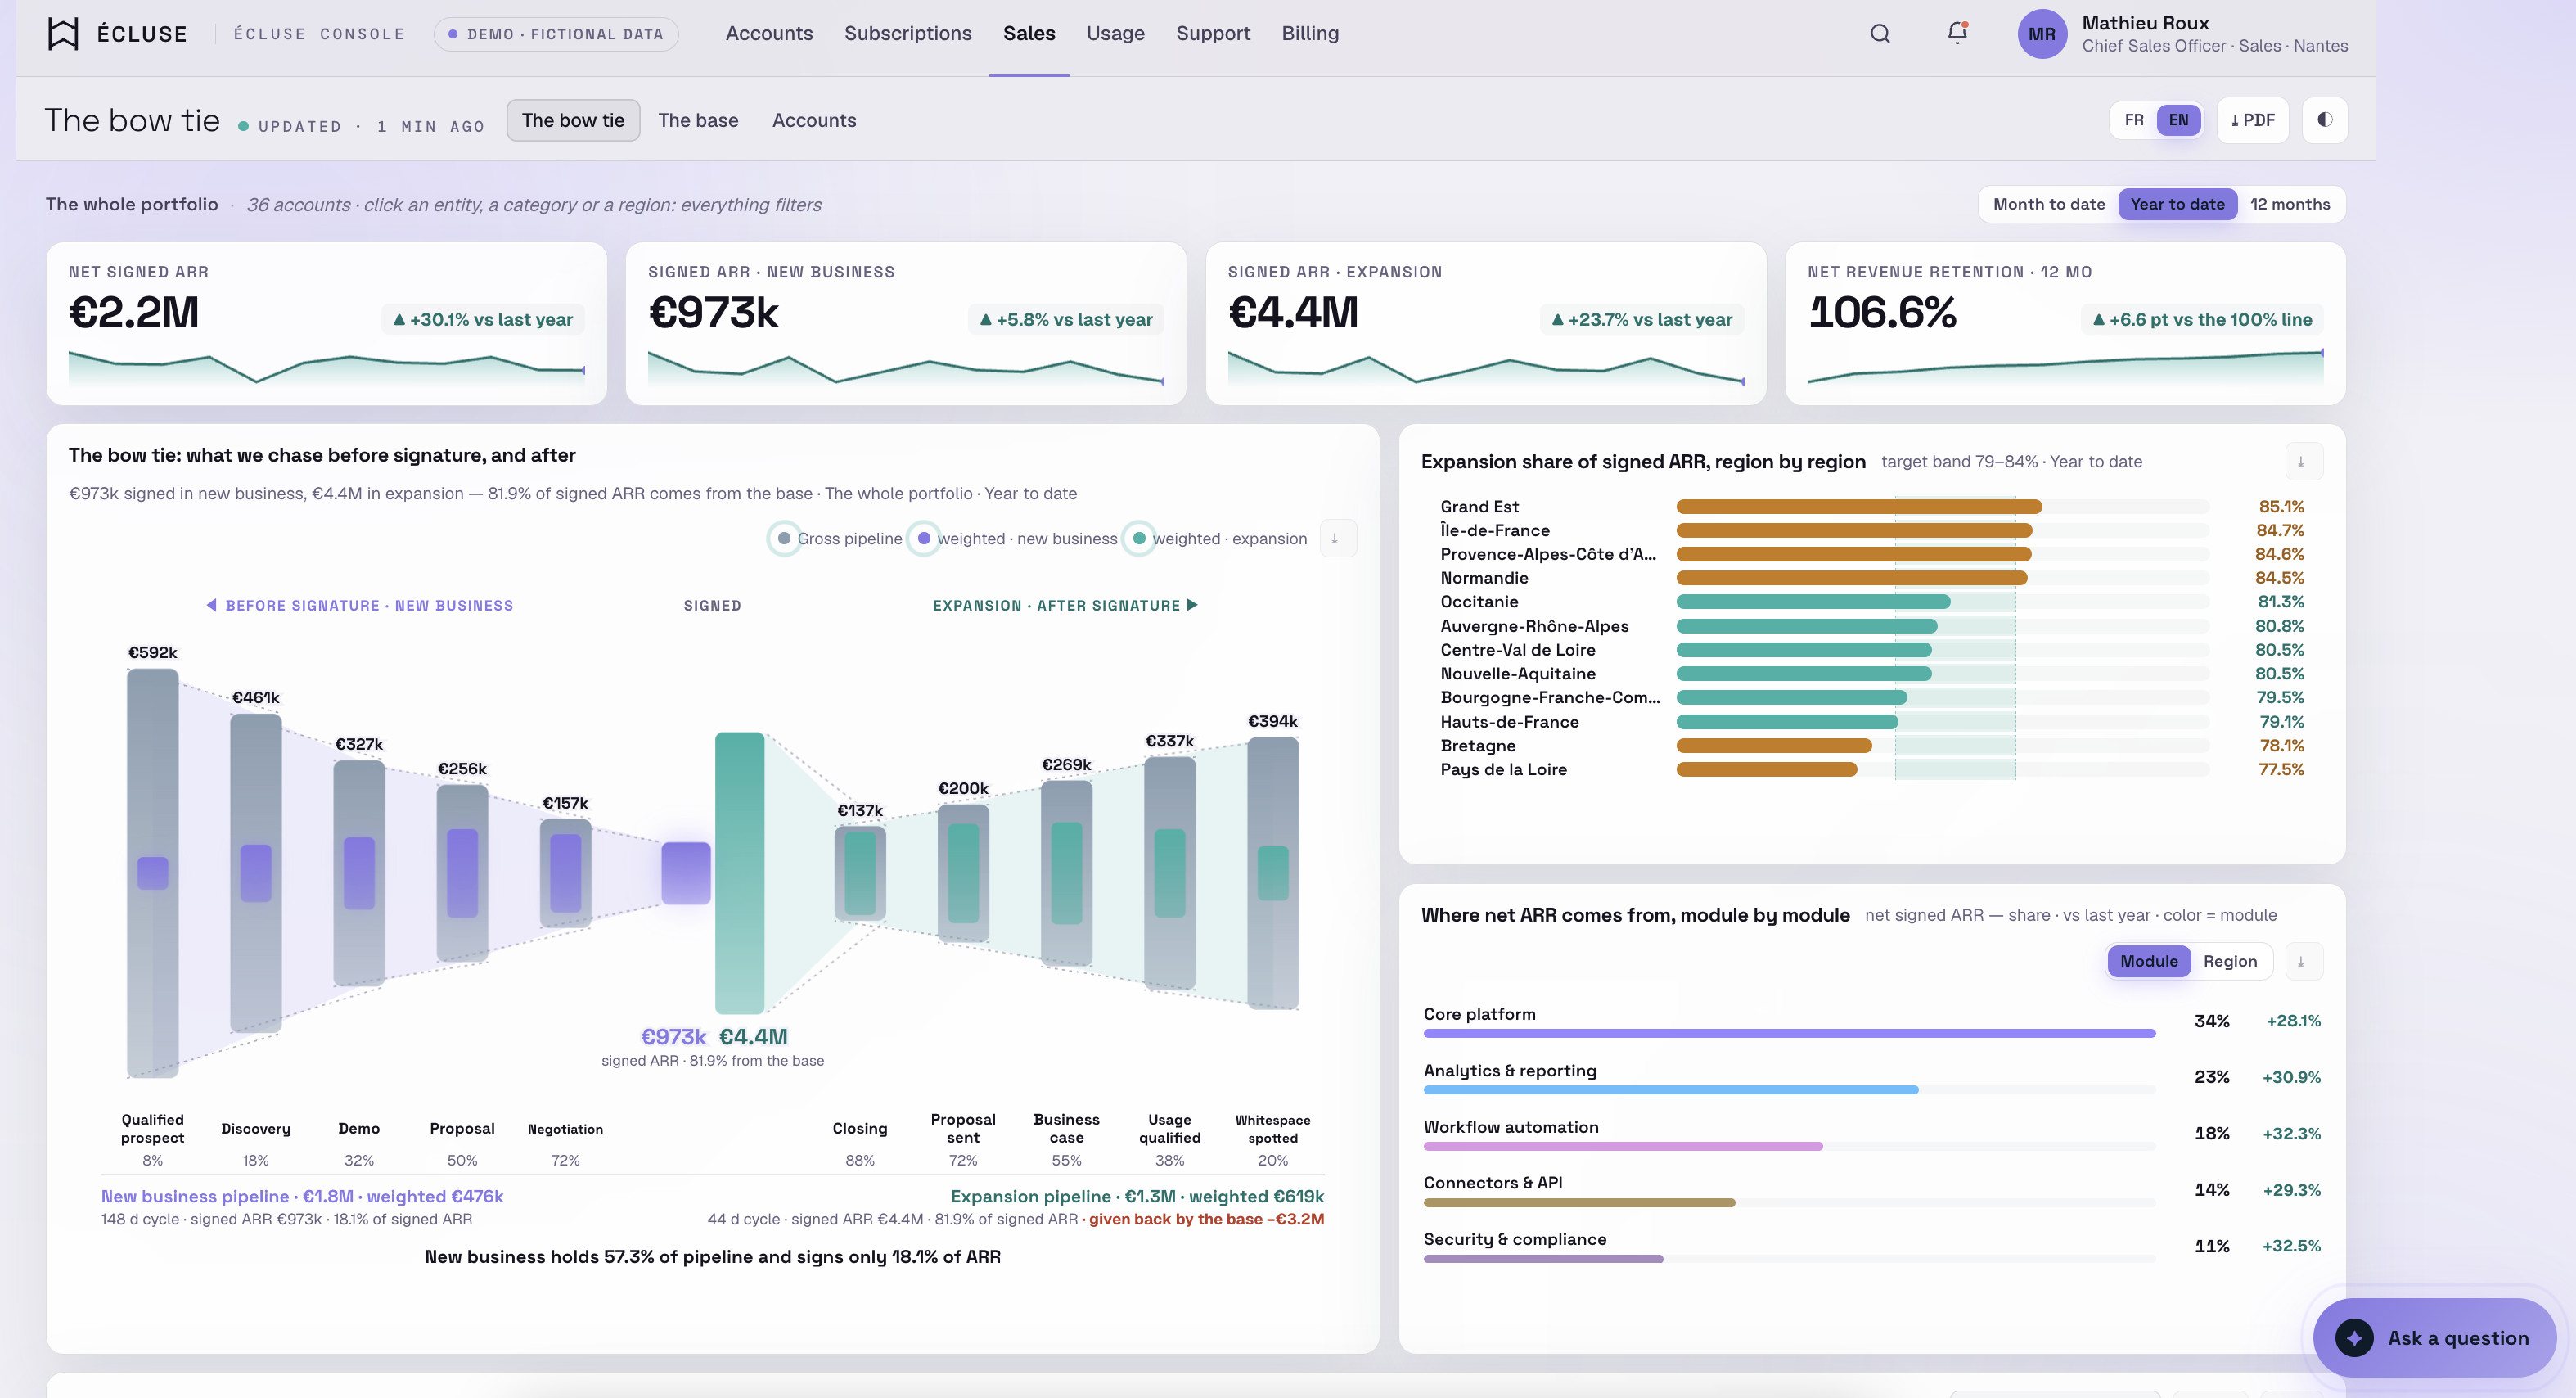
- Sales operations. Pipeline coverage by region. Each manager sees their own team, the VP sees everything, from one app instead of twelve copies of a dashboard.
- Operations. Stock and service levels by site, with an alert when a site drifts from its target.
- Leadership. One weekly view of the company, built around the five questions the leadership team actually asks.
The best way to understand it is to click through one. You can explore a live demo app built by the Crew.
When do you need a custom data app instead of more dashboards?
More dashboards rarely fix a trust or usage problem. These are the signs you have outgrown them:
- Two reports give two answers for the same metric.
- Dashboards exist, but the team still exports to a spreadsheet to work.
- Every new question becomes a ticket that waits for weeks.
- Different people should see different data, and you manage it by duplicating dashboards.
- Your business needs a view that standard bar and line charts cannot show.
- One person "knows the numbers," and nothing works when they are away.
When you do not need one: a single team, stable metrics, and a BI tool people actually use. Keep what works.
Your brief in.
A certified app out.
The Crew connects your sources, defines your metrics and ships an app your team can trust.
Why is building the app now the easy part?
Because AI made the first version cheap. It did not make the next twelve months cheap. In 2026, ChatGPT and Claude can connect to your data and build an interactive dashboard in an afternoon. We cover what they do well in can you build a business dashboard with Claude or ChatGPT? The build is no longer the bottleneck.
What is left is the part that turns a build into an app a team can rely on. Someone has to:
- Run it. Keep the data fresh and fix what breaks when a source changes.
- Govern it. Hold one definition per metric and decide who sees which rows.
- Change it. Ship what the business asks for every week, without starting over.
- Answer for it. Own the fix when the number on the board slide is wrong.
That work never ends, which is why an AI-built dashboard is a prototype, not a product until someone owns it. It is also where the hidden cost of DIY AI analytics sits. For what that upkeep looks like week to week, see business dashboards, built and run for you.
Who can build a custom data app and keep running it for you?
Five options exist, and they split on one question: who does the work after launch?
| Option | Who builds | Who runs it after launch | Governed metrics and permissions | Cost model |
|---|---|---|---|---|
| Build it yourself with AI | You, with ChatGPT or Claude | You | Only if you already have them | Subscriptions plus your time |
| BI consultancy | Consultants | Usually you, after handover | Set up during the project | Project fee or day rate |
| Internal tools studio | Developers | The studio, on a retainer | Depends on the studio | Build fee plus retainer |
| Freelancer or hire | One person | That person, alone | As far as one person can go | Hourly rate or salary |
| Managed analytics service | The provider | The provider, continuously | Built in and maintained | Fixed recurring cost |
If you want the app without building it, running it or hiring for it, the last row is the one built for you. A managed analytics service builds the custom data app on your data, operates it, governs the metrics and permissions, and ships changes when you ask. If you are weighing it against a hire, see before you hire a data analyst: the managed alternative.
Whoever you talk to, ask five questions:
- Will we get an app our team works in, or a set of reports?
- Who runs it after launch, and who fixes it when a source changes?
- Where do metric definitions live, and who maintains them?
- How do we request a change, and how fast is it done?
- Who signs off on what ships, by name?
How does Toucan AI Crew build and run a custom data app?
Toucan AI Crew is a managed analytics service: a supervised crew of AI agents, backed by Toucan's data experts, that builds and runs your custom data apps, with a first result in 48 hours and a human who signs every release.
- Kickoff. You brief the Crew on the decisions your team needs to make. No specs, no technical setup on your side.
- 48 hours. The first version of your app, on your data, reviewed by a human before you open it.
- Day 30. The app is in production, connected to your systems, on a governed semantic layer with row-level security.
- From then on. You ask for changes or improvements directly in the app, in plain language. Requests are unlimited, and each one is done within 24 hours.
The AI agents do the building and running, including bespoke visualizations a standard BI tool does not offer. A named Toucan Lead reviews and signs every release. The Crew keeps the context of your business from one change to the next, so the app gets sharper instead of starting over.
All of it costs a fraction of a hire or a consulting firm. See how the Crew works and how pricing works.
So, do you need a dashboard or a data app?
If one team needs a view of what happened, a dashboard is enough. If your business needs trusted numbers that people act on every day, shaped to how you decide and kept up to date as you change, you need a custom data app.
And if you would rather not build, run or hire for it, have it built and run for you.
Let's talk. Tell us the decisions your team needs to make. We will show you the first version of your app in 48 hours.
Put the Crew to work
on your data.
Send us your brief. Five AI agents and a Toucan expert build, check and run your custom data app.
For the wider picture on where AI fits, see AI for data analysis: LLM, tool, or team?
Frequently asked questions
What is a custom data app?
A custom data app is an application built on your own data around the decisions a specific team makes. It combines views shaped to your business, one governed definition per metric, and permissions per person. Unlike a dashboard, it is used daily and keeps changing as the business changes.
What is the difference between a data app and a dashboard?
A dashboard shows what happened, using the chart library of a BI tool. A data app is built around a team's decisions, with governed metrics, row-level permissions and bespoke views, and someone accountable for running and changing it. The gap is less in the charts than in who builds, runs and governs them.
Who can build a custom data app for my business and keep running it?
A managed analytics service does both. Toucan AI Crew builds a custom data app on your data and keeps running it: AI agents do the work, and a named Toucan Lead signs every release. The first version lands in 48 hours, and it costs a fraction of a hire or a consulting firm.
How do I get a production analytics app without building it myself?
Use a managed analytics service. With Toucan AI Crew, you brief the Crew at kickoff, get a first version on your data in 48 hours, and have the app in production at day 30, with no technical setup on your side. Changes requested in the app are done within 24 hours.
Is a custom data app the same as an internal tool?
No. An internal tool is workflow-first, built for forms, approvals and updating records. A custom data app is decision-first, built so a team can see, compare and act on numbers it trusts. If your main need is data entry, an internal tools builder is the better fit.
How much does a custom data app cost?
The build is only part of the cost. Running, governing and changing the app every week is the rest, whether you pay for it in salary, consulting days or your own team's time. Toucan AI Crew covers building and running for a fixed cost, a fraction of a hire or a consulting firm.