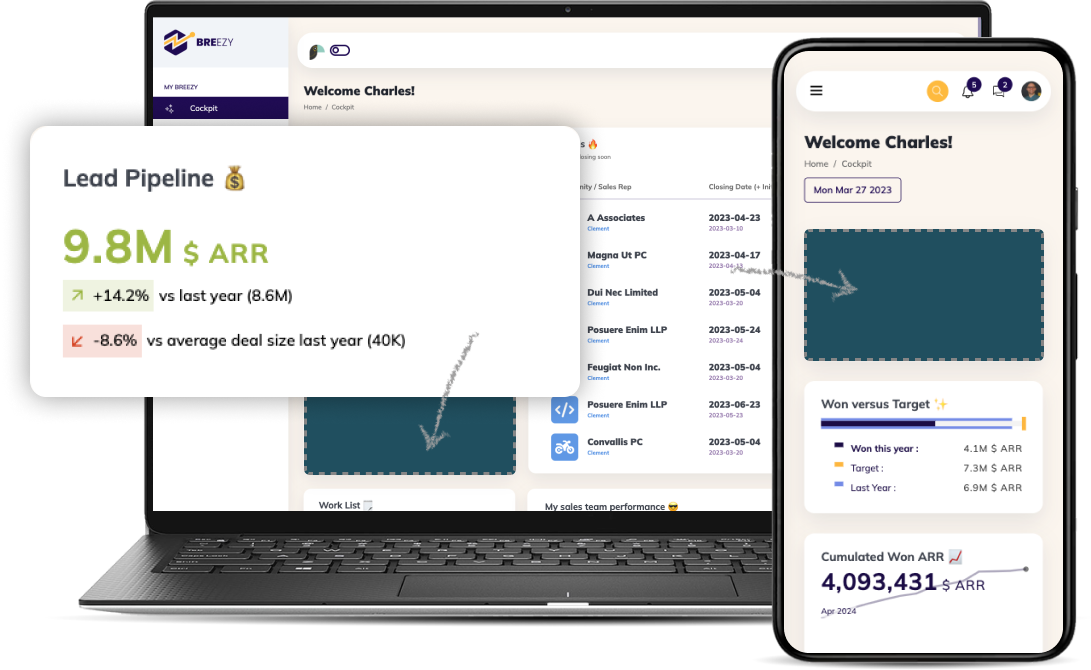
As an ISV (independent software vendor) customer retention can be crucial, and few metrics represent so critical a perspective as those that help outline retention likelihood. The reason? There are many — but among them, some of the most important include that customer acquisition is often far more costly than customer retention, and that the reputation of your product or brand can hinge on customer experiences.
As an ISV, customer retention is often critical to long term success, particularly with subscription-based sales models — but how can it be measured accurately? Taking a data-informed approach can necessitate the use of additional relevant success metrics, including NPS over time, number of tickets per client, license use by the client (by instance), usage rates, churn rates, cumulative cohort revenue, and customer lifetime value.
To better understand these 7 essential metrics for SaaS user retention, their importance, and how they can be used to drive desirable customer outcomes, let’s discuss each one in depth. We’ll explore how each metric works, what they can tell you, and why they’re important.
We’ll start by exploring 5 metrics that are simple to set up, as well as 2 more advanced metrics that may be a bit more complex to get established.
All of these metrics can be utilized effectively with robust reporting and dashboard tools; visualizing these data points can help you create actionable insights from raw data. Let’s jump in.
1: NPS over time
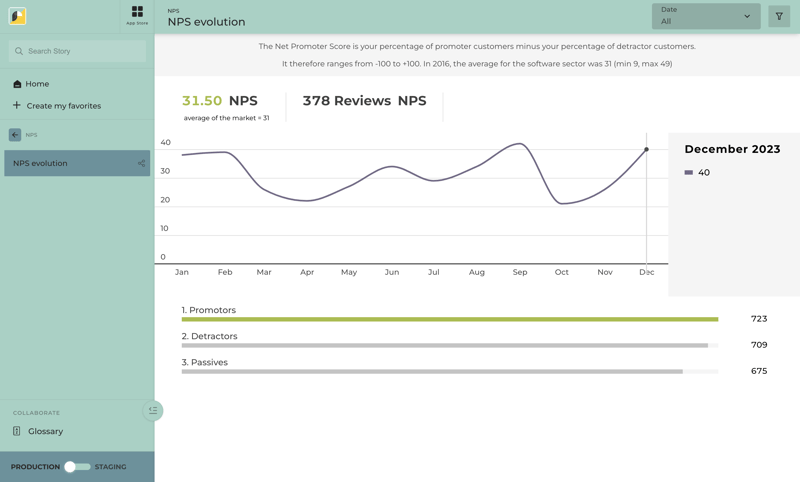
NPS over time, refers to a client’s Net Promotor Score, over time. A Net Promotor Score (NPS) is a simple metric; it’s measured quantitatively through a numerical scale that measures how likely a client is to recommend your service to another individual or entity. The Net Promoter ScoreSM (NPS®) was first developed in 2002, by Bain & Company, and is used to measure customer sentiment. It’s often used as a means of estimating customer loyalty.
Measuring NPS, not just in a single instance in time, but over a period of time can lend you some deeper insight into the customer experience; as scores shift over time, you may be able to glean important insights about how clients’ experiences shift over time, which can help you better understand the long-term customer or client journey beyond onboarding.
Dashboard example:
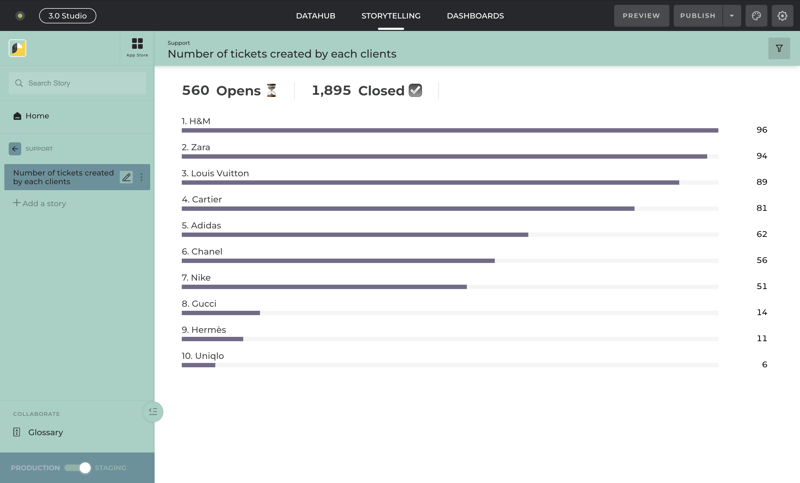
2: Number of Tickets (bug or support request) created by each client
This is a relatively straightforward customer experience metric that can nonetheless provide some deep insights into your clients’ experiences. For SaaS vendors, it’s important to not only focus on the onboarding and sales process but long-term customer success. Since SaaS solutions often rely on a subscription model, long-term use often must offer a client experience positive enough to retain users.
A number of tickets per client metric measures the number of support tickets or bug reports that each client submits. The importance of tracking tickets per client is multifold; not only can this metric help you understand your product’s general ease of use better, but it can also enable you to identify accounts that are more likely to require additional support. This can be crucial in a strategy to reduce churn through data-driven asset allocation efforts. Finding accounts that are facing frequent problems can help you inform your approach to targeted client care.
Frequent support issues that arise across the board can help inform your approach to product improvement and development. Patterns of common issues can be particularly illuminating. This metric can also be cross-referenced with client lifecycle stages (such as onboarding) to help inform your approach to various client experiences. For example, if onboarding is typically accompanied by requests regarding a common configuration issue, you may be able to supplement your onboarding materials to better explain the configuration parameters.
In addition to tracking the number of tickets per client over time, it can be helpful to remain cognizant of related outcomes. Tracking resolution outcomes — such as the time to resolve tickets — can help you establish another source of data from which to hone your approach to customer success.
Dashboard example:
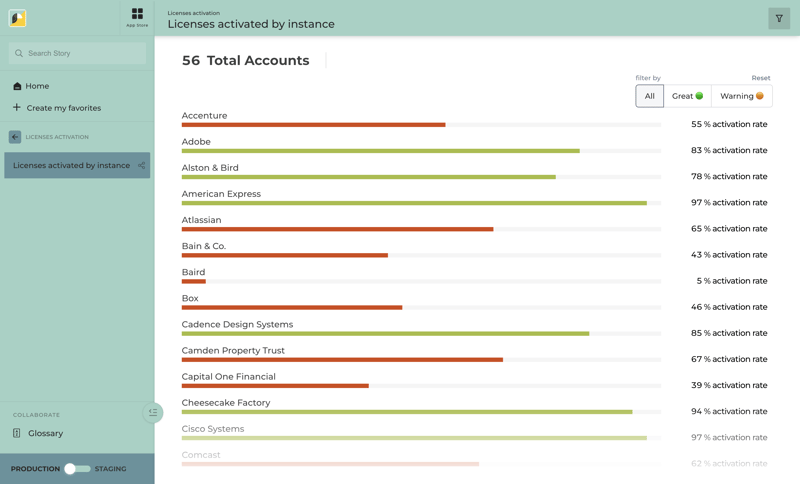
3: Activation Rate by Instance
Another vital metric for customer retention is the activation rate, by instance. In other words, tracking how many licenses a client owns in relation to how many they’ve implemented in distinct instances.
This metric can be vital to customer success, informing not only your understanding of how widely and quickly your product is adopted across accounts, but also the extent to which individual accounts are utilizing your service.
This metric is a helpful means through which you can measure engagement and hone your approach to client success. Low activation rates may warrant investigation into product fit or ease of onboarding.
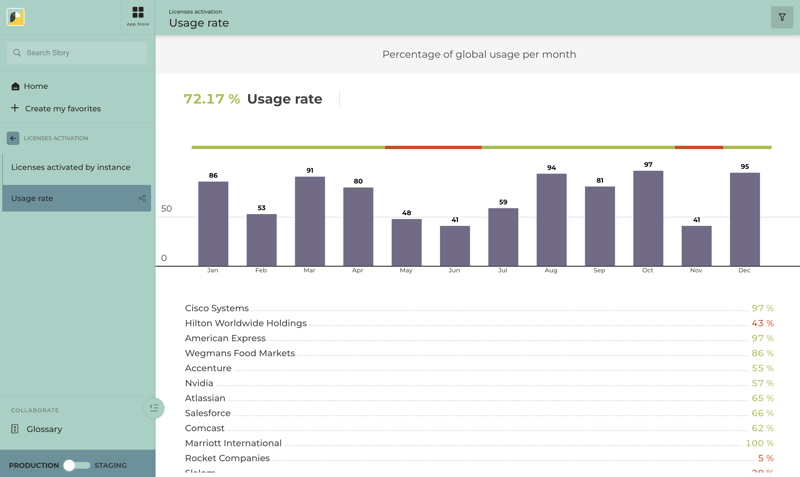
4: Usage rate and number of active users
Usage rate and number of active users refer to metrics that track how many active users are utilizing your service over various lengths of time. Number of active users metrics can look at different lengths of time — such as daily, weekly, or monthly — to lend you engagement insights. Like activation rate, this metric is important for understanding the extent to which users are utilizing your product. Low engagement indicated by low active user counts can warrant additional action.
Not only are daily, weekly, and monthly active user (DAU/WAU/MAU) counts useful for understanding broader trends in adoption and engagement, but when cross-referenced with one another, their interplay can lend you insights into your product’s “stickiness.”
For example, daily active user (DAU) metrics can be compared to monthly active user (MAU) metrics. The mean daily active users for a month can be compared to that month’s total active users to generate an MAU/DAU ratio that can lend insight into the frequency of use. A higher DAU/MAU ratio suggests that a larger portion of your monthly user base is using the product daily, while a lower ratio can suggest the opposite.
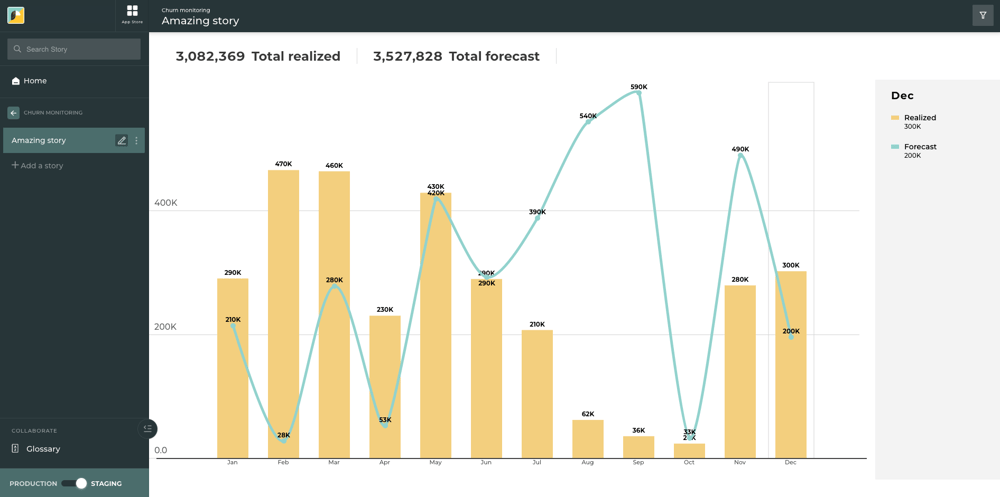
5: customer churn rate
Customer churn is another relatively straightforward metric that nonetheless is crucial to customer success and can lend some deep insights into your product’s market performance, especially in a SaaS subscription model.
Customer churn is simple to calculate: it involves deriving the percentage of customers who stopped using your service in a given period compared to how many customers you had at the beginning of the period.
It can be measured monthly, quarterly, and annually to give you various levels of granularity. At shorter intervals, you can effectively track short-term fluctuations in churn, while longer intervals such as annual churn can lend you better insight into broader long-term trends.
6: Cumulative cohort revenue (CCR)
Cumulative cohort revenue can be a more complex metric to establish than other customer success metrics — but it can provide a wealth of data that can be used to inform future approaches to everything from client acquisition to long-term client success.
It begins by establishing a cohort — a group of clients with an identified commonality (e.g. users who signed up during a certain month, or through a certain marketing platform) and then tracking that cohort’s cumulative revenue over an established period of time (for example, after one year.)
The importance of cumulative cohort revenue as a metric is twofold; this metric can help you better understand how cohorts compare to one another in terms of customer success (for example, do clients who started service through a certain platform or during a certain time period lead to more or less revenue) — and it can also help you establish data points that can be helpful in establishing your Customer Lifetime Value, or CLTV.
7: Customer lifetime value (CLTV)
Like Cumulative Cohort Revenue (CCR), Customer Lifetime Value (CLTV) is a more complex metric that nonetheless can provide a wealth of crucial insights into customer success and expected revenue from customers in the future.
Customer Lifetime Value is calculated taking into account the myriad factors that influence the lifetime value of an individual client across the board, on average. These include factors such as purchase values, purchase frequencies, and retention rates used to establish the average revenue generated per user, which can be compared to the average customer lifespan to indicate an average estimated customer lifetime value.
This metric can be highly useful in informing your approach to the market; by better understanding how much revenue you can expect from your average user, you can tailor your approach to cost considerations, and better ensure that your product is viable to offer. Lifetime value encapsulates a complex set of factors, and by better understanding it, you can take a balanced approach to reducing churn while considering lifetime support costs, for example.
The Bottom Line
In SaaS, improving customer retention can be more than just an ideal outcome — as an ISV, user retention can almost directly translate to viability in many cases. By better understanding your customer retention outcomes through the use of metrics such as these, you can better position yourself to take action when it comes to reducing churn and improving SaaS customer retention.
What’s more, through the use of dashboards and reporting tools, these metrics can be turned into actionable narratives. In visualizing these essential metrics over time, you may be able to more easily identify important patterns and opportunities for improvement.
If you’re interested in finding ways to turn data into actionable narratives — don’t hesitate to reach out. At Toucan, we’re passionate about making data compelling. If you’re interested in seeing how our customer facing analytic tools can leverage the power of storytelling for yourself, don’t hesitate to request a demo today.