A balance sheet provides an overview of your company's financial situation at a particular point in time. The left side of a balance sheet shows assets (what you own) while the right side shows liabilities plus equity. At any time, the two sides must always be equal. Balance sheets are structured based on the following accounting equation:
- Assets = Liabilities + Shareholders equity
Why are balance sheet metrics important?
Financial progress can be hard to assess if you don't have a clear picture of it. Your balance sheet metrics can help you determine where your efforts should be allocated going forward - for instance, to better manage your inventory or collect payments on time.
An organization's balance sheet metrics can provide insight into its financial health from three different perspectives: short-term liquidity position, asset performance, and capital structure.
- Examine the short-term liquidity position. A critical aspect of this assessment is measuring the ability of your business to maintain resources so that it can meet urgent cash demands (e.g., paying employees, supporting production, and repaying loans).
- Measure the performance of assets. An assessment of your organization's ability to generate income and profit from its assets, such as plants and machinery, is included in this process.
- Analyze the capitalization structure. The process involves assessing how your company finances operations and growth by combining debt (e.g., loans from banks or investors) and equity (e.g., investments made by shareholders).
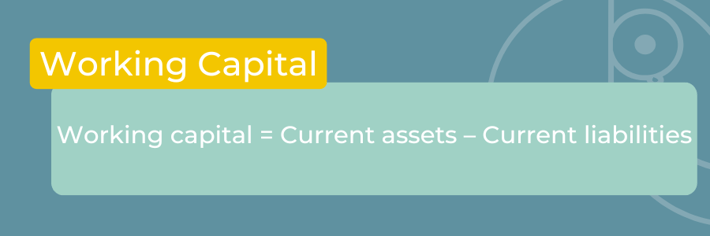
1. Working capital
A business's working capital is how much money it has to purchase inventory and pay interest on its loans.
Having a negative or low working capital indicates that you may face a cash crunch. Contrary to this, a high working capital could indicate the business is not spending enough and that funds are being blocked from being invested in current assets, which can be converted into cash within a year.
To determine your company's ability to stay afloat and support business operations while repaying new debt, lenders and investors look for a balanced working capital.
How to calculate working capital?
An organization's working capital, or net working capital or net current assets, is calculated by subtracting current liabilities from current assets.
An organization's current liabilities include expenses that need to be paid within one year (e.g., taxes owed to the government or money owed to suppliers), while an organization's current assets are its resources that can be converted into cash within one year (e.g., inventory or customers' debts).
Let’s take an example. If a company’s balance sheet has $100,000 in total current assets and $80,000 in total current liability, then the working capital would be $100,000 - $80,000 = $20,000.
So, the company has $20,000 in working capital to pay rent, employees’ salaries, and loans due in the next year, among other short-term obligations.
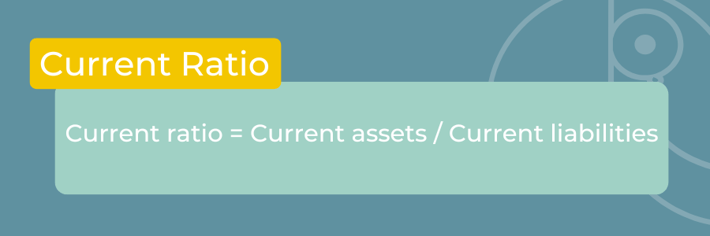
2. Current ratio
An organization's current ratio measures its ability to cover short-term obligations (i.e., bills due within the next 12 months) with short-term assets (i.e., resources that can be converted into cash within the next 12 months).
Using the current ratio, you can determine if your company needs additional liquidity or funds to conduct daily operations.
How to calculate current ratio?
Current ratio is calculated by dividing current assets by current liabilities on the balance sheet.
In general, a current ratio of 1.5 to 2 is considered ideal; anything below 1 may indicate that your company will not be able to repay short-term loans. It is important to note, however, that the value will vary according to the industry in which you operate.
A current ratio under 1 is normal if your business relies heavily on debt to run operations (as is the case for industries such as financial services and utilities).
Let’s take an example. If a company’s balance sheet has total current assets worth $100,000 and total current liabilities worth $50,000, then the current ratio would be $100,000 / $50,000 = 2.
An optimal current ratio of 2 indicates that the company is in good financial health to be able to pay off its short-term liabilities (e.g., rent, salaries) and take on additional debt (if needed).
3. Quick ratio
In contrast to the current ratio, the quick ratio is a more conservative indicator of your company's ability to meet its short-term obligations. That is because quick ratios are calculated only based on the "most" liquid assets. As a result, inventory is excluded from current assets, as it is assumed that inventory (although an asset) cannot be converted into cash rapidly.
Depending on how you define quick assets, you may be able to eliminate other "not-so-liquid" assets in addition to inventory.
More importantly, the accuracy of this ratio depends heavily on how quickly you receive payment from your creditors and on the terms of any financing arrangements you have with them. As the quick ratio provides an indication of your company's immediate financial health, it is also referred to as the acid test ratio.
How to calculate quick ratio?
Quick ratio is calculated by subtracting inventory from current assets and then dividing the result by current liabilities.
An increased ratio indicates better immediate liquidity for your company. It is considered normal to have a quick ratio of 1 which indicates that your company is well-positioned to meet its short-term obligations.
Let’s take an example. If a company’s balance sheet reports total current assets worth $100,000, total current inventory worth $20,000, and total current liabilities of $70,000, then the quick ratio would be ($100,000 - $20,000) / $70,000 = 1.14.
With a quick ratio of 1.14, the company appears to be in a strong liquidity position to pay off its short-term debts and continue its operations.
4. Cash conversion cycle
A business's cash conversion cycle (CCC) shows how well it manages two of its most important assets: accounts receivable and inventory.
A business's CCC indicates how well it is performing in collecting payment due from customers and selling stock. The CCC is calculated in days. If your CCC value is low, you are likely to receive payment on unpaid invoices and sell your inventory within a reasonable timeframe. In contrast, a high number indicates you are having difficulty collecting dues and may soon run out of funds.
How to calculate cash conversion cycle?
Calculating CCC is based on three factors: the days sales outstanding, the days payable outstanding, and the days inventory outstanding.
In inventory management, Days Inventory Outstanding (DIO) is a measure of how long your inventory sits idle on average. It’s calculated by dividing the average inventory by the cost of goods sold and multiplying the result by 365 days.
- DIO = (Average inventory / Total cost of goods sold*) x 365
The number of days it takes for you to collect payment from your customers after a sale is known as the days sales outstanding (DSO). It’s calculated by dividing average accounts receivable by total revenue received and multiplying the result by 365 days.
- DSO = (Average accounts receivable / Total revenue*) x 365
Days payable outstanding (DPO) is the average number of days it takes you to pay your bills after they become overdue. It’s calculated by dividing your average accounts payable by cost of goods sold, and multiplying the result by 365 days.
- DPO = (Average accounts payable / Total cost of goods sold*) x 365
Cash conversion cycle is calculated by adding days sales outstanding and days inventory outstanding, and subtracting days payables outstanding from the result.
Let’s take an example. A company’s balance sheet reports $2,000 in inventory, $3,000 in accounts payable, and $10,000 in accounts receivable at the beginning of a fiscal year. By the end of the fiscal year, the balance sheet reports $4,000 in inventory, 5,000 in accounts payable, and $12,000 in accounts receivable. Cost of goods sold and total revenue, according to the income statement released at year-end, are $50,000 and $150,000, respectively.
For this company, CCC would be:
DIO = [($2,000 + $4,000)/2] / $50,000 x 365 = 21.9 days
DSO = [($10,000 + $12,000)/2] / $150,000 x 365 = 26.7 days
DPO = [($3,000 + $5,000)/2] / $50,000 x 365 = 29.2 days
CCC = 21.9 + 26.7 – 29.2 = 19.4 days
In other words, the company collects customer payments and sells inventory on average in 19.4 days.
5. Return on assets
An organization's return on assets is an indicator of its ability to generate value (or profits) for its shareholders and owners.
An organization has a number of assets, such as cash, machinery, and plants. Return on assets is a measure of the efficiency with which managers are reaping profits from company assets. This is a key indicator of the overall financial health of the organization.
In different industries, companies may have dramatically different ideal returns based on operating costs and other factors. Tech companies, for example, will not necessarily be able to generate profits from their assets the same way food and beverage businesses will.
How to calculate return on assets?
A company's return on assets is calculated by dividing its net income by its average total assets. An income statement (or profit and loss statement) can be used to calculate net income.
Let’s take an example. If a company’s balance sheet shows total assets worth $700,000 and its income statement shows profits worth $40,000, then return on assets would be $40,000 / $700,000 = 0.05 or 5%
This means the company generates 5% returns by utilizing $700,000 worth of assets.
6. Debt-to-asset ratio
The debt-to-asset ratio is used to determine the extent to which your company's performance (asset generation) is financed through loans and debts. Banks and creditors use this ratio to determine the riskiness of lending money to your business. As a result, it is also known as the debt ratio.
Having a high ratio indicates that your asset generation is primarily funded by debt. You may be required to pay a higher interest rate on new loans in that case. Alternatively, a low debt-to-asset ratio may increase your chances of obtaining low-interest loans by establishing your credibility as a debt manager.
How to calculate debt-to-asset ratio?
Debt-to-asset ratio is calculated by dividing total liabilities (as they involve debt components) by total assets on the balance sheet.
When a company has a high debt-to-asset ratio, it means it is accumulating debt rather than building assets to make money.
Let’s take an example. If a company’s balance sheet shows total assets of $200,000 and total liabilities of $50,000, then its debt-to-asset ratio would be $50,000 / $200,000 = 0.25 or 25%.
This means 25% of the company’s asset generation and growth is financed through debt from creditors. It also means that the remaining 75% is financed through equity.
7. Debt-to-equity ratio
An organization's debt-to-equity ratio represents how much of its operations are financed by debt as opposed to equity. The term equity refers to investments made by shareholders, whereas the term debt refers to loans and credit taken on by the company. It is another important indicator of your company's capital structure and tells whether your company is more dependent on loans or shareholder equity.
How to calculate debt-to-equity ratio?
Debt-to-equity ratio is calculated by dividing total liabilities by total equity reported on the balance sheet.
It is considered good to have a ratio lower than 1 indicating that your company is generating funds to finance operations through equity rather than taking on debt. A high ratio, however, could indicate that lenders may be reluctant to lend to your company, thereby affecting your ability to borrow during times of economic stress or an emergency.
Let’s take an example. If a company’s balance sheet shows total liabilities of $700,000 and total shareholder equity of $200,000, then its debt-to-equity ratio will be $700,000 / $200,000 = 3.5
With a debt-to-equity ratio of 3.5, the company is using a significant amount of debt money rather than shareholders' funds to operate. As the company is already heavily leveraged and under debt, lenders would consider it highly risky to lend to it.
The Bottom Line
You can use the balance sheet data to make a few quick and easy calculations to gain a better understanding of a business's financial situation. Among these metrics are the current ratio, quick ratio, working capital, and debt-to-equity ratio. While the ideal value of each of these metrics varies greatly depending on the nature of the business, the numbers are still telling. Access these numbers without the help of accountants or technical knowledge using analytics solutions like Toucan. See what conclusions everyone in the company can draw from your balance sheets by having access to all of these ratios.