Fixed Asset Turnover: All You Need to Know
Fixed asset turnover, usually mentioned in the context of the fixed asset turnover ratio (FAT ratio), is used to measure the operating performance of an organization. The ratio compares net sales from a company’s income statement with fixed assets from their balance sheet and then draws a measure of that organization’s ability to generate net sales from fixed-asset investments. The ratio mostly focuses on what’s referred to as “PP&E”: property, plant, and equipment.
Put simply, the fixed asset turnover ratio helps determine how effectively a company is using its assets to generate sales. Therefore, the higher a fixed asset turnover ratio, the stronger the indication that a given company has been able to effectively use it’s asset investments to generate sales.
It’s important to note that, while interesting, a high FAT ratio does not provide much insight around whether a company is actually able to generate solid profit or cash flows. That’s why it is often only one of many important financial management KPIs that successful teams are tracking today.
Diving deeper into fixed asset turnover
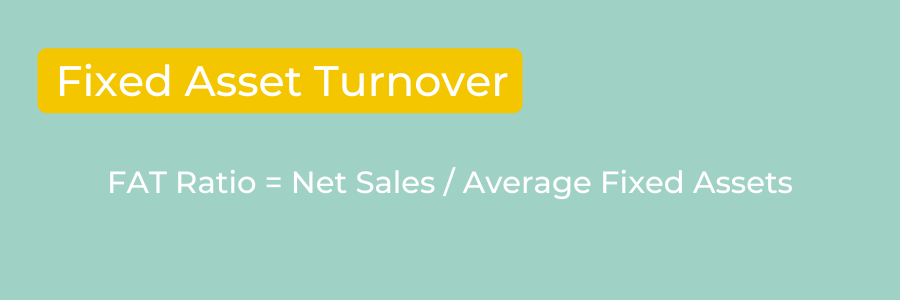
If you want to understand fixed asset turnover, you’re going to want to know how to calculate it. The formula to do so is as follows:
Fixed Asset Turnover Ratio = Net Sales / Average Fixed Assets
The components that make up the formula include:
- Net sales, which is comprised of gross sales minus returns and allowances
- Average fixed assets, which is the beginning balance of net fixed assets minus the ending balance (the calculation is then divided by 2)

Fixed asset turnover ratios are most commonly used, or at least generally most relevant, in the manufacturing industry. Why? It makes sense: manufacturers make significant investments in PP & E with the hope of increasing output. In such instances, it's important for investors to understand if those investments are positively impacting sales. Other organizations, such as those in the software industry, spend much less on fixed assets.
How do I interpret my fixed asset turnover?
This is ultimately the question we need, or which is most important, to answer. Simply put, the higher the turnover ratio, the more efficient a company is (at least at managing its fixed-asset investments).
As with many other financial ratios and metrics, there’s no “golden number” that you should be striving for, especially taking into account the variance between industries, company sizes, and so on.
It’s, therefore, most practical, and generally most impactful, to compare FAT ratios with historical figures within an organization. Additionally, it can be useful to compare them against industry averages and with the competitors that most directly reflect a company's size and positioning.
Fixed assets vary a lot between companies (and especially between industries), so some fixed asset turnover ratios are going to be a lot more relevant than others. Take, for example, our previous and somewhat classic comparison: fixed assets for manufacturing vs software companies. The fixed asset base for a manufacturing company is going to be significantly higher than the software company.
Because it's important, we’re going to emphasize (again): strong fixed asset turnover ratios are not reflective of profitability. If you have a strong FAT ratio, you could still be losing money as an organization!
Side note: fixed asset turnover is NOT the same as asset turnover
It’s worth noting that fixed asset turnover, and the FAT ratio, are not the same as the asset turnover ratio. The latter focuses on total assets, as opposed to fixed assets, which serves to indicate the effectiveness of more management-level decisions (on things such as capital expenditures and other assets) vs fixed assets alone. Both are helpful in establishing more data-driven cultures.


