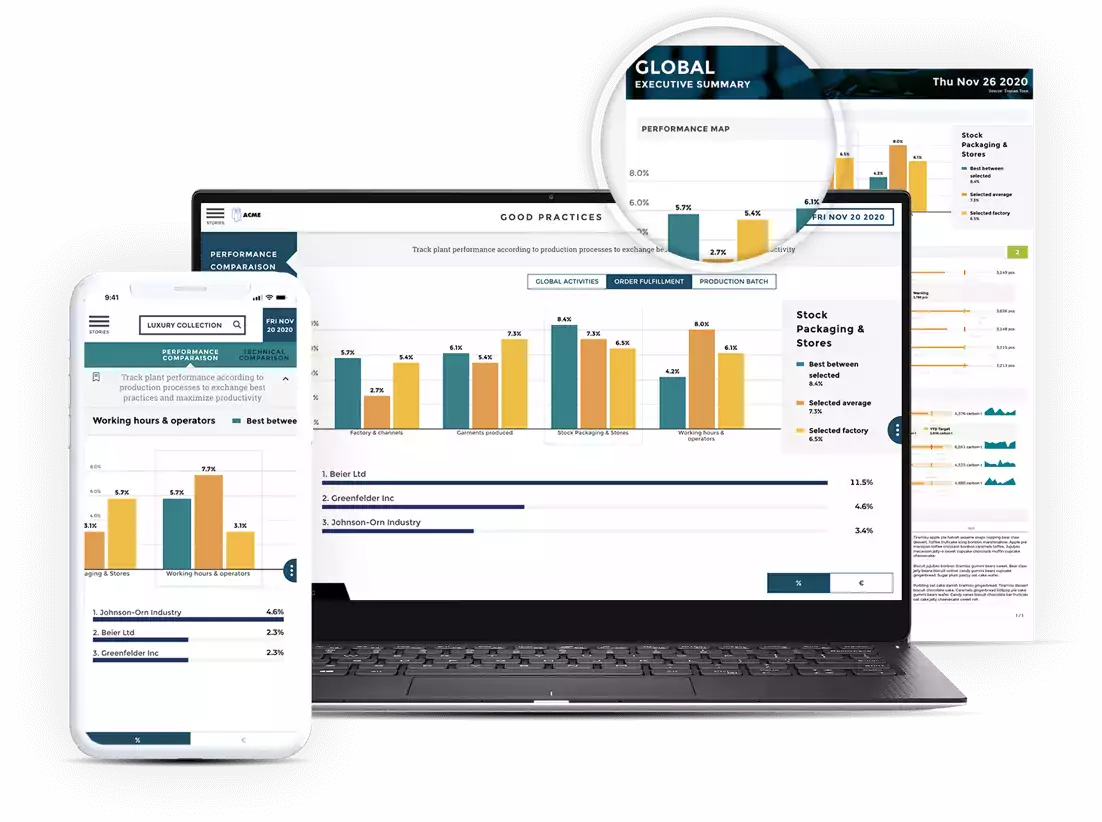
Did you know that by 2024, 75% of businesses will have various data centers to share and manage business-critical data reporting?
Data reporting delivery is a crucial aspect of any company's operations. Automating data reporting delivery is vital for streamlining operations and improving accuracy. It enables data-driven decisions within any company.
With automation, you can change how you report data, ensuring you get correct and timely information to help you succeed. Read on as we discuss how to automate data reporting delivery, which will help your company be more productive and make better decisions.
Manual Data Reporting: The Need for Automation
Here we'll shed light on the downsides of manual data reporting processes. These include the following:
- Manual reporting processes are prone to human errors
- It is tedious and labor-intensive, taking valuable time away from more strategic activities
- It can cause delays in accessing critical information
- Manual data reporting can be costly
Automation for data reporting, on the other hand, offers the following advantages:
- Automation reduces manual tasks
- It minimizes the risk of human errors
- It facilitates reporting growth
- It maximizes cost savings
Defining Reporting Requirements
Before starting the automation process, it's essential to perform in-depth interviews and surveys with key stakeholders. These will help you learn about their specific reporting needs.
Knowing the specific needs of each division allows you to tailor the automated reporting system.
Defining Types of Automated Reports
Different departments may need distinct types of reports. This is to track their performance effectively. For instance, the following:
- Sales teams may need sales performance reports
- Marketing teams may need campaign analytics
- Finance departments may seek financial statements
You must categorize and rank these reports based on their significance and impact.
Determining Report Frequency and Format
Not all reports need to be generated at the same frequency, nor must they all be in the same format. Real-time reports may be crucial for some departments, while others prefer weekly or monthly summaries.
Similarly, reports can be in any of the following forms:
- Easy-to-read dashboards
- Complicated spreadsheets
- Visual presentations
By knowing the right frequency and style, stakeholders will get information in the right amount of time that is easy to understand.
Data Collection and Integration
The success of any automated reporting system hinges on the reliability of the data it processes. Let's look into the significance of data quality, ensuring that the information collected is:
- Completely accurate
- Up-to-date
- Free from errors
Data integrity and uniformity are both critical for keeping all records consistent and the same.
Data Collection
Data has to be collected from various sources. Here are the steps to gather data:
Identify Data Sources
Determine the data sources that hold the information you need for reporting. This could be any of the following:
- Internal databases
- Cloud-based applications
- Third-party APIs
Establish Data Connections
Set up connections to access the data from each source. This involves obtaining the necessary credentials and permissions to ensure secure data access.
Extract Data
Use data extraction methods or query languages to pull the relevant data from the identified sources. This process retrieves the required datasets and prepares them for further processing.
Integrating and Consolidating Data
Data integration is a crucial step to ensure all data from various sources come together in a unified manner. It combines and merges data into a single source for analysis and reporting.
Here are the steps to integrate and consolidate data:
Data Mapping
Create a data mapping process to align and match the fields and attributes from various datasets. This ensures consistency and coherence when combining the data.
Data Transformation
Transform the data into a standardized format to facilitate seamless integration. This process involves cleaning, filtering, and harmonizing data elements to remove inconsistencies.
Data Loading
Load the transformed data into a central database where all information from different sources is stored.
Data Validation
Verify the accuracy and completeness of the integrated data. This will ensure that no vital information is missing or duplicated.
Data Maintenance
Implement regular data maintenance procedures to keep the integrated data up-to-date and relevant. This includes periodic data refreshes and updates from the original sources.
Data Transformation and Analysis
Before data can be analyzed, it needs to undergo a thorough cleaning and preparation process. You must ensure your data is the following:
- Free from errors
- It Is Consistent
- There are no missing values.
Cleaning and preparing the data can lay a solid foundation for accurate and reliable analysis.
Ensuring Data Is in the Correct Format
Data comes in various formats. Not all of them may be suitable for analysis. You must convert and organize data into a standardized format compatible with your chosen reporting tool.
This step is crucial in ensuring seamless data integration and analysis.
Exploring Data Analysis Techniques and Tools
Once your data is cleaned and formatted, it's time to extract valuable information. It would be best if you searched for various data analysis techniques and tools available. It can be any of the following:
- Regression Analysis
- Data Clustering
- Data Visualization
Choosing the Right Reporting Tool
In the market, you can find various big data reporting tools. Picking the right one that fits your company's needs and budget is vital.
Choosing the proper reporting tool is essential for several crucial reasons:
Efficient Data Analysis
The right tool can streamline data analysis processes. This makes extracting valuable insights from complex datasets easier and faster.
Accurate Decision-Making
A reliable reporting tool ensures the accuracy of the data presented in reports. Inaccurate or misleading information can lead to wrong decisions.
Tailored Visualizations
Different departments have unique reporting needs. The right tool allows the customization of visualizations.
Seamless Integration
Compatibility with existing systems and data sources is crucial for a smooth reporting process. The right tool should integrate with other software and databases.
Cost-Effectiveness
Investing in the right reporting tool can lead to cost savings in the long run. An efficient tool reduces the following:
- Manual labor
- Minimizes errors
- Optimizes resources
This ultimately improves the organization's bottom line.
Reporting Scalability
As businesses grow, their reporting needs evolve. Choosing a scalable reporting tool ensures it can handle increasing data volumes. This ensures it meets future demands without significant disruptions.
User-Friendly Interface
The tool should be easy to use. It will allow all employees to use data without extensive technical knowledge.
Data Security and Compliance
Data security is paramount in today's digital world. The right reporting tool should have strong security measures in place.
Continuous Support and Updates
Reporting tools should come with regular updates, improvements, and technical support. This ensures the device remains up-to-date and reliable, even as technology evolves.
Competitive Advantage
Companies that use the power of the right reporting tool gain a competitive edge. They can adapt faster to the following:
- Market changes
- Identify emerging trends
- Make data-driven decisions that lead to success
Designing and Automating the Reporting Workflow
Once you have selected the appropriate reporting tool, the next step is to design a workflow that aligns with your reporting requirements and company goals.
Designing a Workflow
Here are the steps to design a workflow using your chosen reporting tool:
- Clearly define the objectives and goals of your data reporting process
- Identify the stakeholders receiving the reports and specify their reporting preferences
- Select the report components, including charts, graphs, tables, and text
- Integrate the necessary data sources into the reporting tool
- Establish connections to fetch updated data from the source systems automatically
- Organize the sequence of reports in the workflow to ensure that each report serves a purpose
Before fully implementing the workflow, thoroughly test and validate each report's accuracy and functionality
Scheduling and Automating Report Generation and Delivery
Automation is a key advantage of using reporting tools. It enables you to schedule and automate report generation and delivery. Here's how to do it effectively:
- Determine the frequency at which reports should be generated
- Select the preferred delivery channels for different stakeholders
- Implement automated triggers
- Periodically review the automated workflow
Monitoring and Maintenance
Monitoring and maintenance are vital aspects of any automated data reporting system. Once the system is up and running, monitoring its performance continuously is crucial.
Monitoring the Automated Reporting System
Monitoring allows you to identify and address any issues that may arise promptly. Here are some tips for troubleshooting and resolving issues:
- Configure the reporting tool to send real-time alerts for critical issues or data discrepancies
- Monitor data sources and ensure data is collected accurately and on time
- Regularly review generated reports for accuracy
- Address technical glitches that may impact the automated process
Reviewing and Updating the Reporting Process
The business world is dynamic, and reporting requirements can change over time. Periodic reviews of the reporting process are crucial to ensure its continued effectiveness. Here's why it's essential and how to go about it:
- Stay aligned with the company's current goals and objectives
- Gather feedback and incorporate their input to enhance the reporting experience
- Keep up-to-date with your reporting tool's latest features and updates
- Ensure that all relevant team members know the reporting tool's features and functionality
- Continuously monitor the reporting process's performance
Data Reporting Delivery at Your Fingertips
Automating data reporting delivery is a game-changer for companies. Using the above tactics and data visualization will improve your data reporting. It will propel your company to new heights of success.
Ready to change your data reporting and visualization? Contact us and discover a powerful data storytelling platform. Take the next step towards data-driven success with us today!


