EN
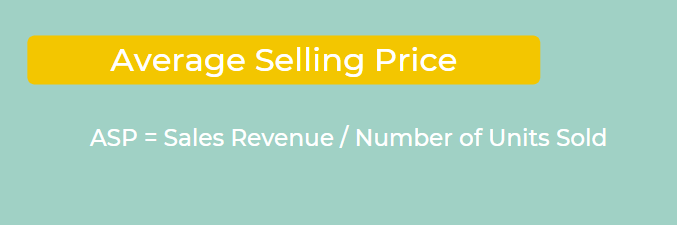
Average Selling Price - what is it?
The average selling price (ASP) is a metric that measures the price at which a business sells a good or service. Because it takes the average of prices, the way to calculate ASP is to divide total revenue earned by service or product sales by the number of units sold. There are many uses for average selling price, mainly strategizing the price positioning of products in a new market.
ASP has become a vital aspect of financial reporting, with companies often disclosing their average selling price during earning calls. Investors find the indicator as one of the most important disclosures of a firm’s success and future profitability.
The price of a product will depend on what stage of the product cycle it is positioned. Older, outdated products that are losing demand will have a lower ASP, while newer, high-demand products will have a high ASP
Calculating Average Selling Price
In this example, we’ll use a firm that sells toothpaste. The company sold 100,000 units at $2.99, 75,000 units at $3.49, and 50,000 units at $3.99 in the year 2021.
- 100,000 * $2.99 = $299,000
- 75,000 * $3.49 = $261,750
- 50,000 * $3.99 = $199,500
The firm’s total revenue for 2021 is $760,250, selling 225,000 units in 2021. To find the average price sold, divide these two figures, which results in an average selling price of:
- $760,250 / 225,000 units = $3.77
Who Uses Average Selling Price?
Financial Strategists
Companies that are positioning a product in a new market utilize average selling price to synthesize a pricing strategy. For example, a company is trying to undercut a product that costs $50 in the beauty industry. Depending on the positioning of their product, they may price their premium offering at $75 or undercut the firm at $40.
Decision-makers
The average selling price can be an important indicator of market demand. For example, if a wealth management firm sees the average selling price for a service dying down, that may be a sign that the service is in lower demand. Decision-makers can then use that information to fund services with a higher ASP and devote fewer resources to the low ASP service.
It is important to remember that a low ASP is not always a negative thing, and a high ASP is not always a positive thing. The driving force of ASP is the optimization of price for a firm’s target market. For example, a coffee shop may sell a more desired coffee at a higher ASP of $5.
However, a competing firm may generate more revenue by selling more cups at $4.50. Price setting is a difficult and high-risk science, however, with the right data, firms can make the decision much easier and lower the risk.
Investors
Investors view ASP as a major component when tracking a company built on a singular or few products. Take Spotify as an example, whose premium plan is its most popular offering that offers the best value for consumers. Both private and public investors will track the price of the subscription model to draw conclusions about Spotify’s financial health and relevance to consumers.
If investors notice a drop in price for Spotify’s premium plan, they may start asking whether the firm’s product is dropping in demand, or whether the firm can sell more subscriptions at a lower price. It is then up to decision-makers to release other financial metrics to show the firm’s plan for continued success.
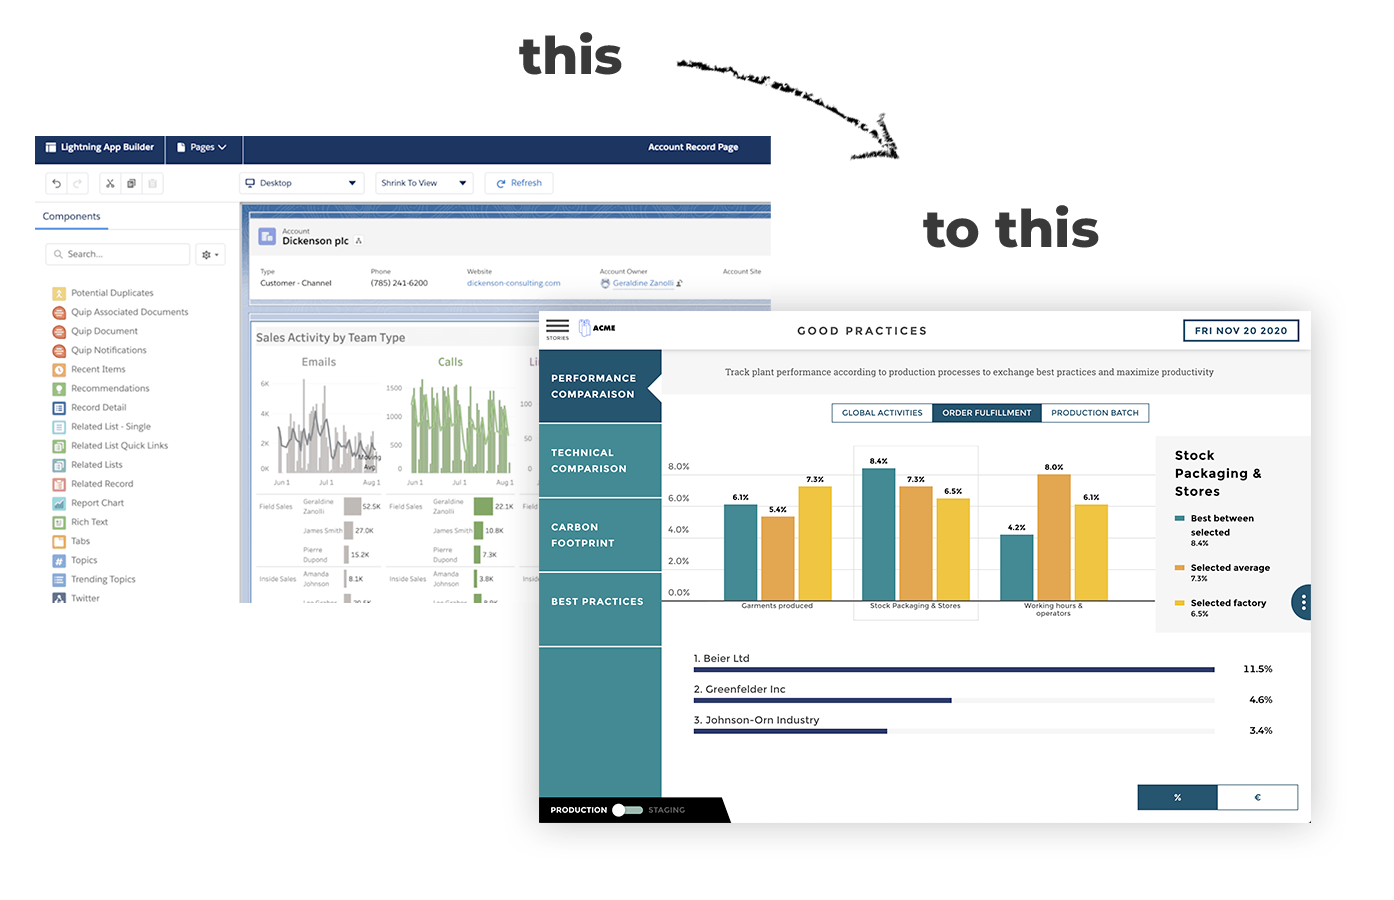
How to Track Average Selling Price?
A financial dashboard utilizing cloud technology is a must-have for any firm tracking its financial indicators. For example, Toucan’s cloud-based data visualization tool offers many features that are appealing to decision-makers, simplifying a process that old data convoluted.
Now, decision-makers and finance professionals can view their dashboards change in real-time, no data experts or ph. Ds required. Toucan’s app is easy to understand, promotes collaboration directly in the application, is optimized for mobile devices, and instantly exports lucid reports to PDFs.
These new data visualization tools allow firms to expend fewer resources and effort on a complex data stack and spend more time making decisions. With a data visualization tool, indicators like ASP turn into exciting information, rather than a dreaded headache.