Financial Dashboard KPIs - Find what is important for you
A financial dashboard is a specific type of dashboard that allows you to monitor the financial performance of an organization. To do so, like all dashboards, Key Performance Indicators (KPIs) encompass the key metrics necessary to track performance. However, these KPIs must be carefully selected to allow the most relevant performance to be monitored.
Whatever the industry, profitability and rises in performance levels are the main goals of a well-run business. Even not-for-profit organizations can utilize financial dashboards to ensure they are spending their donations in an optimal manner. This dashboard should provide visibility into all aspects of:
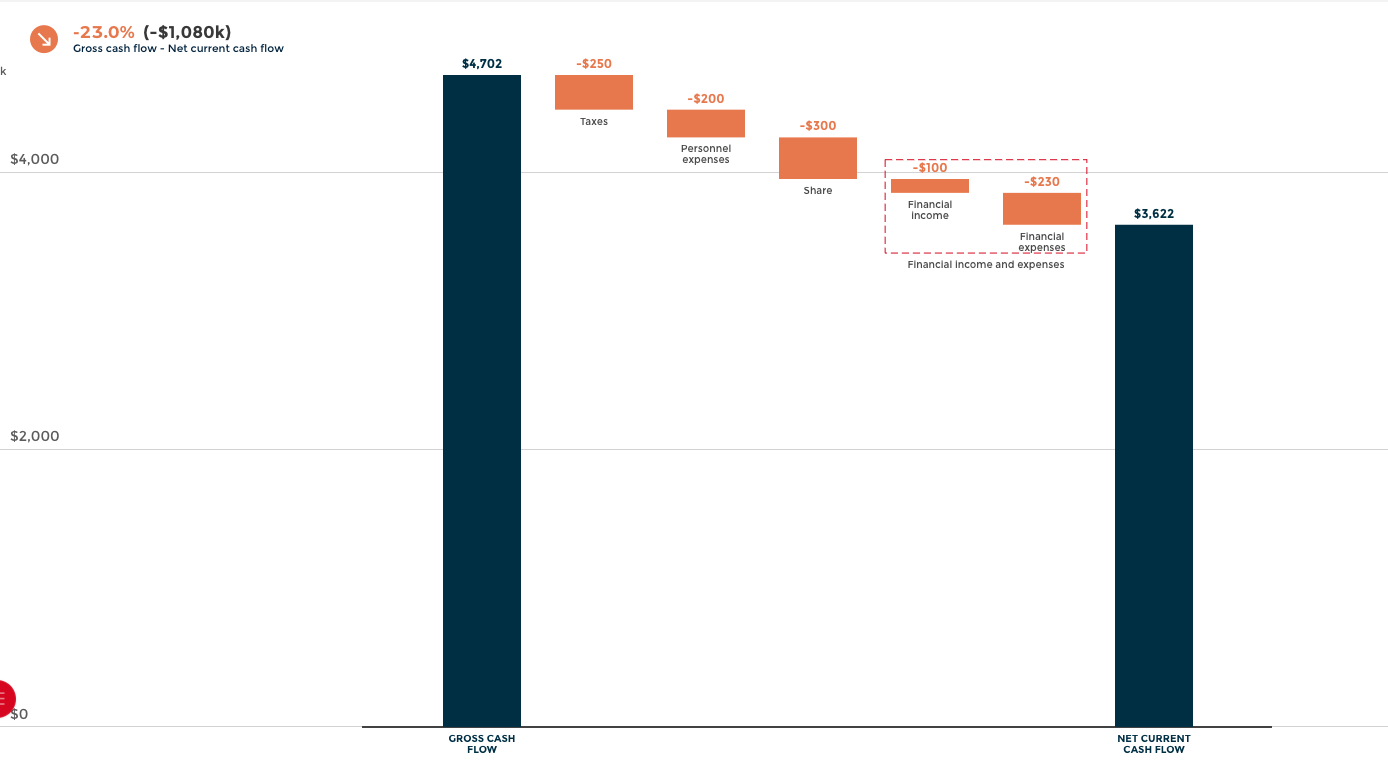
- Cash flow
- Losses
- Profits
- Other financial metrics
This information must be presented in a clear and legible manner, and the dashboard must not be convoluted by unnecessary or irrelevant Key Performance Indicators. By implementing the most relevant KPIs, you will be able to create a complete financial dashboard to interact with different metrics and automate the reporting and analysis processes. This will make your financial data and insights more informative and more easily manageable. Here are the best financial KPIs to integrate into your dashboard to help you optimize and achieve your financial goals.
There is a very wide variety of financial KPIs, and several major archetypes of financial dashboards can be distinguished (cash management, profit and loss, CFO, financial performance, etc.). However, these five indicators can be considered as the most important and popular for any type of financial dashboard.
- Revenue growth. This KPI is one of the most basic and can be measured by tracking sales from one period to the next and then subtracting the revenues of the previous period from the current period. This number is then divided by the total turnover of the previous period. The percentage obtained indicates the growth in revenues.
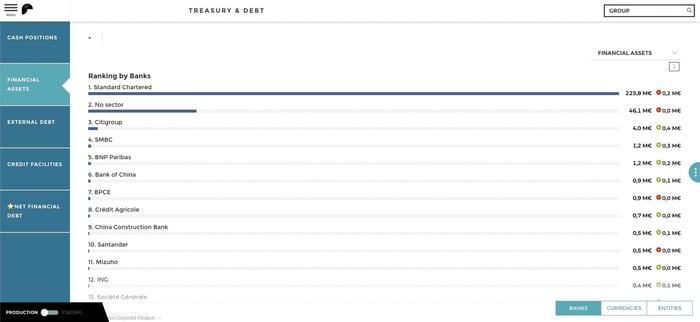
- Revenue sources. Analyze revenue by customer and service to determine which customers and segments are most profitable. You can then make informed decisions to support the growth of your business by focusing on the most lucrative services or customers
- Income concentration. The purpose of this income concentration is to ensure that the majority of your revenue does not come from a single client. Because if you lose this customer, the consequences will be disastrous for your revenue. Divide the revenue per client by your total revenue and multiply the result by 100. This will give you the percentage of revenue allocated to each client. If your income is too concentrated, try to diversify your client portfolio.
- Profitability over time. By monitoring your expenses and revenues, you can compile profit and loss reports to analyze your performance over a specific period of time.
- Working capital, i.e. the cash theoretically available for the company's operations. These funds may come from banks or private investors willing to support you. By tracking this metric, you will be able to better plan your operations. To calculate working capital, subtract your debts from your current resources. If your resources are greater than your debts, working capital is positive. By dividing current resources by current debts, you can calculate the working capital ratio. This ratio should be between 1.2 and 2.
You now know the most relevant KPIs to integrate into your financial dashboard. Dashboards can be used by company executives, department managers, or financial experts to gain a comprehensive view of the data and include all employees in acting on insights.