%20(2000%20%C3%97%201000%20px)%20(400%20%C3%97%20200%20px)%20(600%20%C3%97%20350%20px)-1.png?width=800&name=Blog%20Banner%20for%20Website%20Content%20(2240%20x%20960%20px)%20(2000%20%C3%97%201000%20px)%20(400%20%C3%97%20200%20px)%20(600%20%C3%97%20350%20px)-1.png)
Data visualization for finance has arrived. Finance professionals wouldn’t give these solutions the time of day even 5 years ago, but nowadays, you can find hundreds of options to go with.
Don’t believe us? The adoption rate for embedded tools across industries is 60%, compared to traditional BI’s 20%. If you’re thinking to yourself, “Why the drastic change?” we can give you some insights.
Big data has monopolized the financial industry since its inception. After 20 years of traditional BI, corporations found that it comes with more problems than anticipated. Here are a few:
- Expert knowledge is needed to extract its full potential
- Lower ROI at the expense of necessary experts
- Glitchy interfaces and unreliable reporting
- Weak visualization capabilities
- High costs
These are just the start of problems with big data’s implementation in the finance world. Does big data have a role to play? Most definitely. But the trends don’t lie, and finance professionals are hungry for data visualization tools that can tell the story of their financial metrics, ESG initiatives, and operational benchmarks.
So how do data visualization tools differ from their traditional BI counterparts? Here are just a few examples:
- Less expert knowledge is required to extract its full potential
- Lower costs
- High levels of reporting and dashboard personalization
- Seamless integration between devices
- Highly scalable
Now that we’ve explored why data visualization has emerged as a big player in the eyes of finance professionals, here are the three aspects of financial data visualization tools that are the most important:
- Simple to understand
- Excellent technical capabilities
- Reasonably Priced
We will evaluate each tool generally based on these three aspects while breaking down more in-depth aspects for each solution.
Toucan
Simple to Understand ✅
Adequate Technical Capabilities ✅
Reasonably Priced ✅
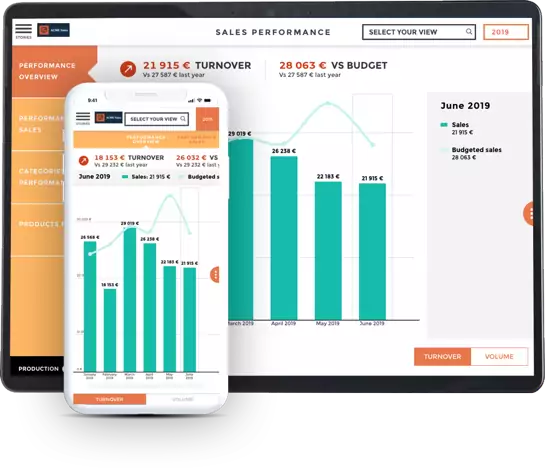
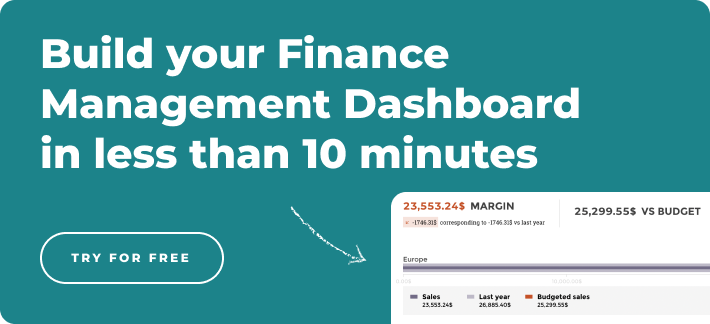
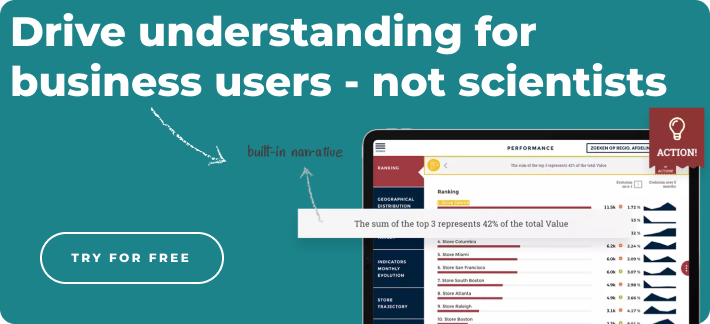
As a newer tool looking to cater to professionals from every background, Toucan’s financial analytics solution offers a compelling package for any finance professional. The solution’s powerful data storytelling capabilities tell lucid stories about a firm’s finances, including strong reporting capabilities. With rapid app deployment, best-in-class dashboard building, and mobile device optimization, Toucan's embedded analytics offer an enticing package to finance professionals looking for a new generation reporting tool. Individuals with little data experience can also harness the potential of the platform, which has a low learning curve.
Toucan’s data visualization platform has been revolutionary for finance professionals lacking an effective and elegant reporting solution. As a cloud-based platform, Toucan can process large quantities of data in real-time, which are available on any device, at any time. This platform is for any firm that is looking for a collaborative, simple, and cost-effective financial reporting tool.
Tradingview
Simple to Understand 🚫
Adequate Technical Capabilities ✅
Reasonably Priced 🚫
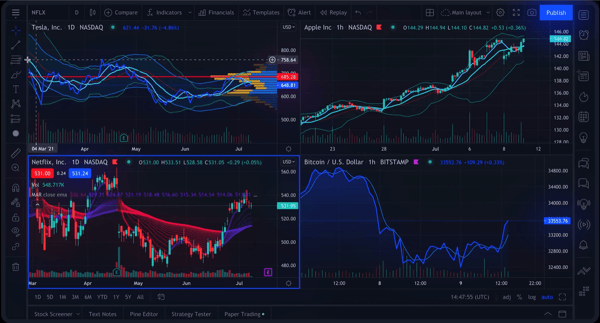
Founded in 2011, TradingView has become a clear favorite for investors. This web-based platform offers many features, including over 12 chart types, the ability to view up to 8 charts per tab, detailed visualization of market movements, and access to community-built indicators. The platform's UX and capabilities are differentiators, with many reviewers sharing positive experience's on the platform. Where TradingView really lags behind is its pricing and offerings. The platform offers a free plan with very limited functionality, while its paid plans are quite expensive. Customer service and community page moderation are also other weak points of the platform.
TradingView has received positive feedback from experienced traders, mostly utilizing their pro subscription plan. The platform severely limits free user features, which may potentially cause them to seek a more effective free platform. This tool is perfect for experienced traders who have the capability to pay $60 a month for a premium subscription.
Asset-Map
Simple to Understand ✅
Adequate Technical Capabilities 🚫
Reasonably Priced 🚫
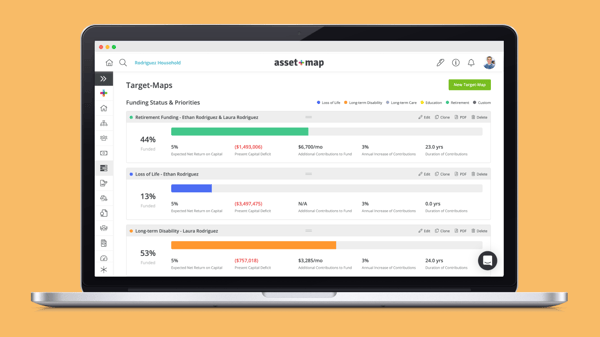
Asset-Map is a financial visualization tool focused on providing finance professionals with an efficient visualization tool for clients. The platform provides data in wealth management, investment management, and insurance markets. To date, the platform has mapped over 1 million people and $1.4 trillion in financial instruments.
Asset-Map's biggest strength is its presentation capabilities, with user reporting versatility in complex use cases. The platform also offers robust onboarding programs for more technical features. While Asset-Map is a great tool, users are expecting more from the platform. Although it includes some technical features, users report the lack of more important features that the platform excluded. The lack of plugins and integrations with third-party organizations is also a weak point of the platform.
Asset-Map is a great platform for simple client reporting, especially in wealth management. While the tool has garnered praise for its simplicity and low learning curve, it sacrifices technical features to achieve it. Asset-Map is solely a reporting wealth management tool for professionals that already have more technical assets in their data stacks.Spreadsheet Server
Simple to Understand ✅
Adequate Technical Capabilities 🚫
Reasonably Priced 🚫
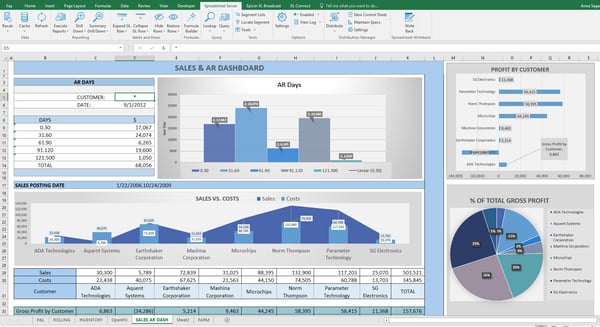
With many finance professionals still utilizing Excel for reporting, Spreadsheet Server’s solution aims to improve the capabilities of Excel-based ERP reporting. The solution claims to offer a more efficient and accurate alternative to native ERP reporting tools, with users generally reporting success using the platform.
Spreadsheet Server is optimized for hundred of systems and is simple to use for individuals with low data expertise. Data is easily importable into the platform and users report high reporting capabilities. Where the platform lacks, however, is its usability for multiple users. For businesses that want more than one user, they must purchase a separate license for each user.
Spreadsheet Server is a great alternative for companies utilizing Excel for ERP reporting. However, the tool struggles for robust financial departments looking to entrust the reporting process to multiple individuals across departments. The tool's lack of speed and performance in areas may also be an issue for firms that are used to snappy and modern solutions. The tool best suits a finance department for a small market company that entrusts one individual with financial reporting.
Pepper
Simple to Understand ✅
Adequate Technical Capabilities ✅
Reasonably Priced 🚫
A marketing platform targeting investment managers, Pepper has gained favor among many professionals in the industry. This cloud-based tool offers an all-in-one approach to financial management, including CRM, deal management, fund operations, reporting, and integrated fund management.
Pepper's interface is the platform's strong suit. Sleek and modern, the platform offers its users a high level of personalization and customizability. Its CRM and portfolio management tools have been well received by reviewers, and the platform handles multiple workflows well. However, like Spreadsheet Server, Pepper lacks connectors to crucial third-party tools and a clear onboarding process.
Pepper is for investment managers looking to simplify their data stack. As an affordable and cloud-based platform, this solution offers an appealing package for managers unhappy with a complex data stack. However, this tool may not satisfy those looking for a true all-in-one platform, with users complaining about the lack of third-party compatibilities.
Which Tool is Right for You?
As with any industry, professionals are constantly on the hunt for data tools that fit their specific use cases. In reality, although there are hundreds of available options, corporations may struggle to find the solution that helps them achieve their financial and operational goals.
These 5 solutions all have their perks for their target audience, however, most professionals are looking for a tool that helps simplify their data stack and provide a significant return on their investment.
Toucan's financial reporting solution seeks to fulfill these expectations, implementing cloud-based embedded analytics to provide in-app collaboration, mobile device optimization, rapid app deployment, and dashboard building.