


A clear perspective on your data
In order to maintain a clear overall perspective on their company’s market and competition, marketing teams should have access to a dashboard that provides all the information they need. This should include information about their own company’s performance, as well as about their competitors, allowing them to make a variety of different comparisons. They also need a comprehensive overview of yearly goals and industry trends.
Which indicators should be tracked?
For effective decision-making, marketing teams should have access to the following KPIs :
- Time-based indicators: have goals set for this month/half-year/year been achieved? How do these figures compare to last year’s goals?
- Geographical indicators: how is our company performing, both locally and internationally, and how does this compare to our competitors’ performance?
- Economic indicators: How is our brand performing in the context of our market? How about our competitors’ brands? How can we adapt our pricing and brand image most effectively?
- Product indicators: What are our most and least popular products, and why?
Comparing these indicators can offer a clear perspective and help with decision-making that will improve performance.
An example of marketing reporting
Here’s an example of a dashboard that displays various different types of data.
The home page shows an overview of the brand’s overall performance. This can be filtered by month (this example shows July 2017), as well as by product type or by country.
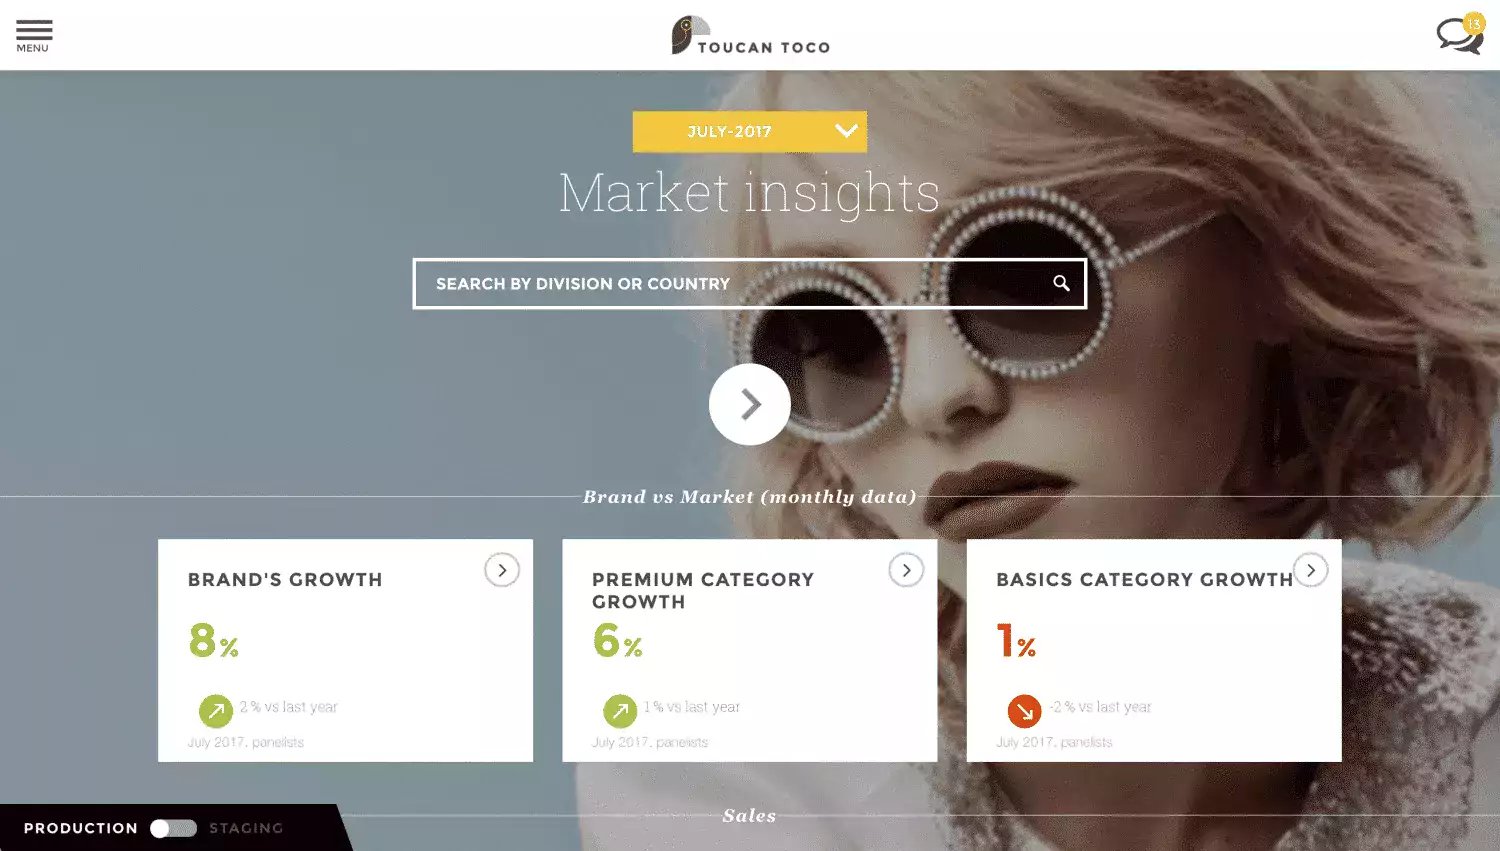
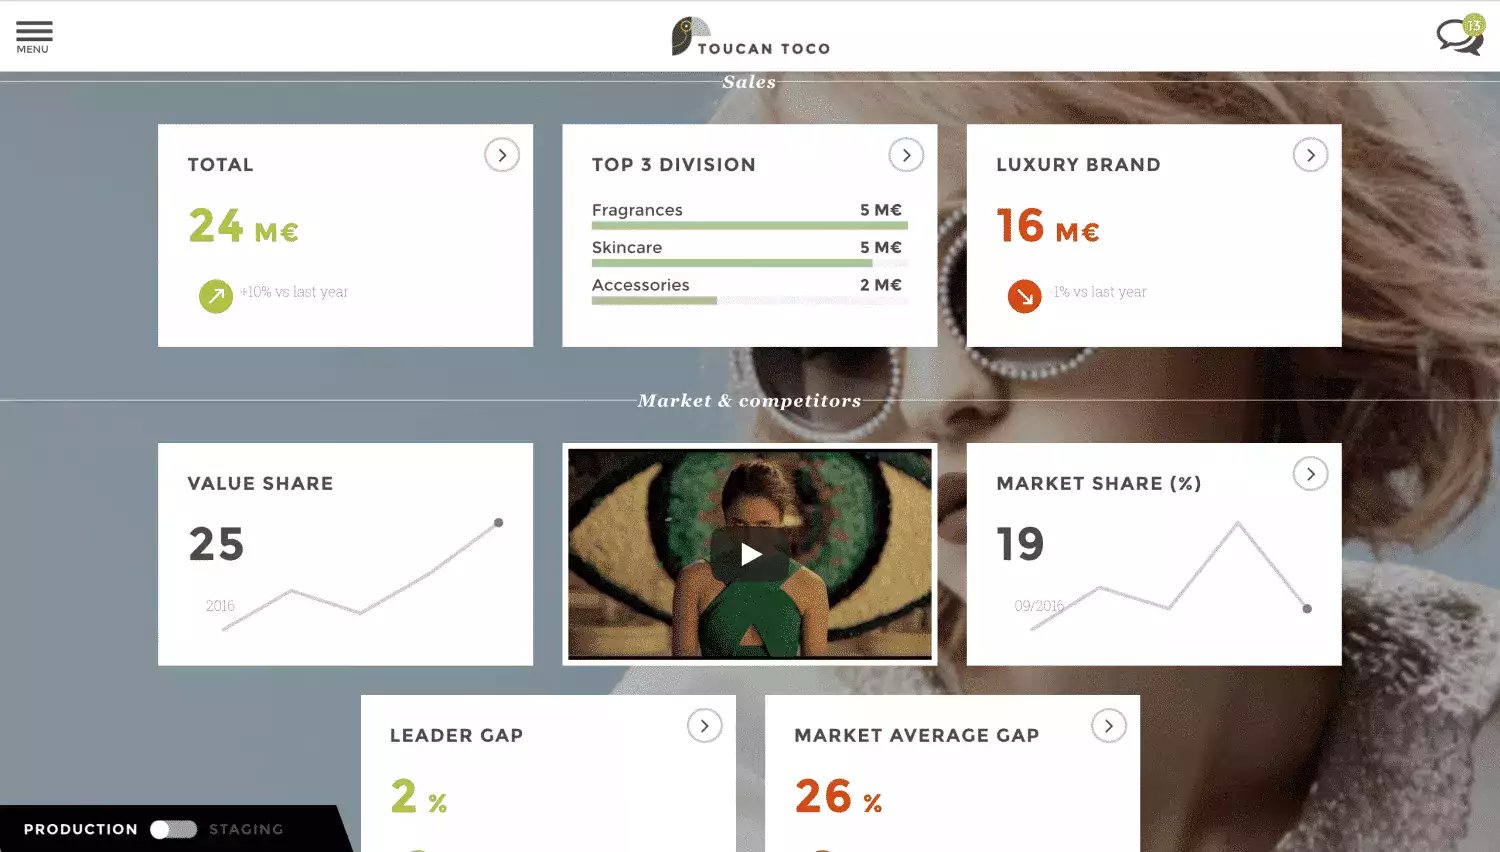
It is also possible to see sales performance results, including turnover, the 3 top-performing product types, as well as the brand’s performance in relation to its market.
Figures on market share are also shown and can be compared to those of the competition.
Beginning with an overall perspective, the app then offers the opportunity to go into further detail on specific performance indicators.
It includes three tabs: performance, market and versus.
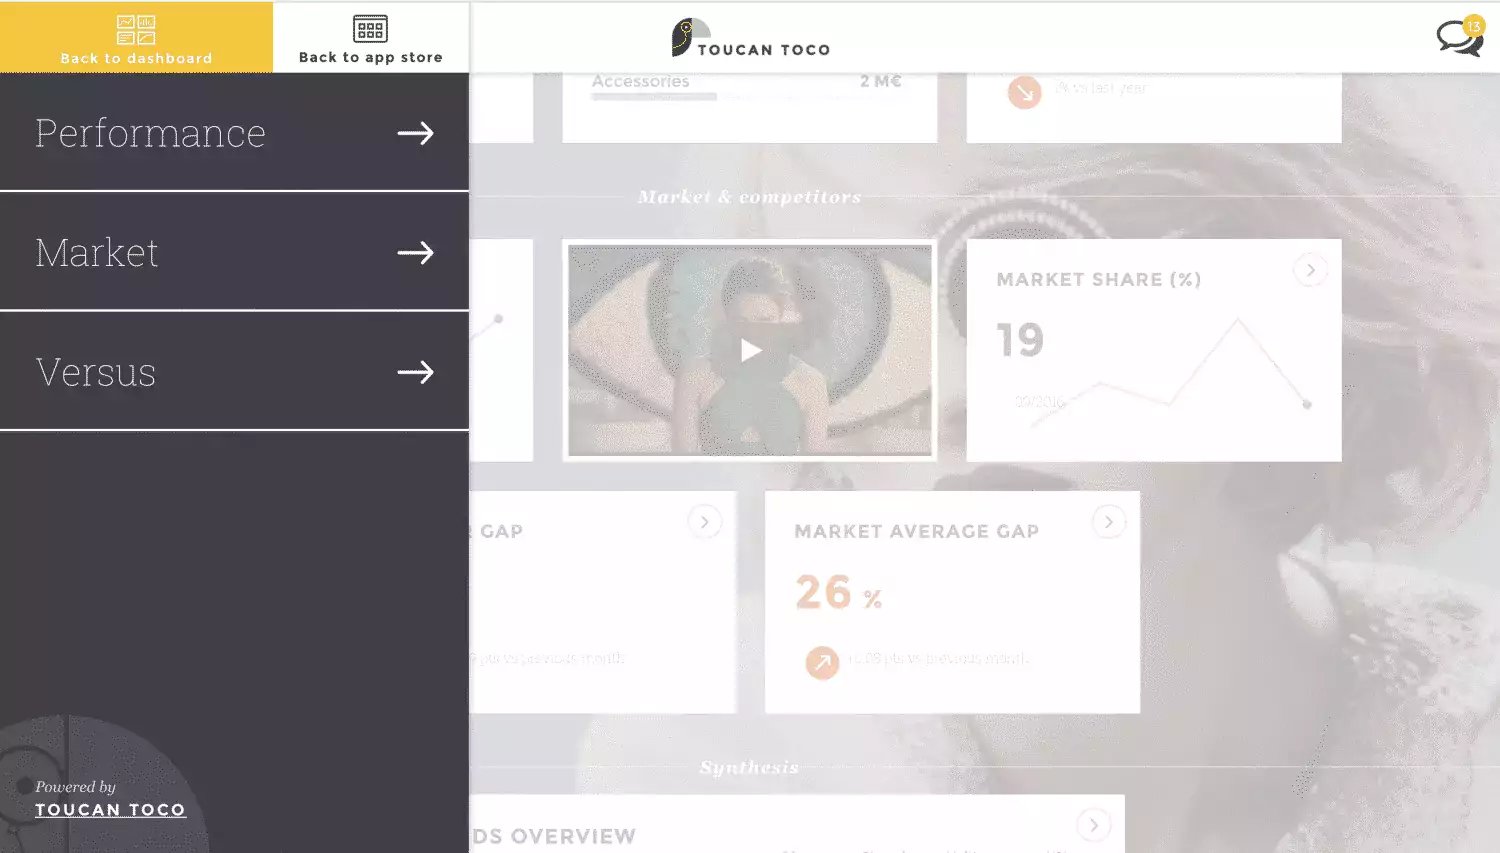
Performance
In this tab, you can compare sales results with targets that have been set, and keep track of trends, portfolio management and Top Division, a ranking system that lets you compare different brands’ performance, based on various criteria.
In the “Sales realized vs. target” tab, a heat map clearly shows whether or not these targets have been achieved. You can view performance by brand and by market (in this example, it is shown by region).

In the “Trends” tab, a chart shows changes in the brand’s growth rate over a six-month period. Data can also be filtered by product type (fragrances, skincare and makeup) and compared to the market.
In May, the brand’s growth rate decreased by 9.1%, while the market rate increased by 3% Market.

Market
The “Market” tab shows changes to market share value by product type, as well as marketing and R&D investments made by the brand.
In this example, for Louis Vuitton, out of €1 250M, 83% was invested in R&D and 29% in marketing.

Versus
The “Versus” tab shows changes in market share, in Euros or in percentages. The “multi-criteria” tab offers a comprehensive overview that allows you to compare your brand with competitors.

These tabs provide a wealth of information on the fragrance market.
In addition, a brand’s data on growth, marketing and R&D investments, the number of units sold and revenue earned can be compared to the competitors of their choice.
Conclusion
Your marketing reporting must enable you to compare your performance to that of your competitors.
These examples show how a brand can easily and conveniently compare their competitors’ performance to their own.
A brand’s performance data can be divided by product type and shown from different perspectives: by the number of units sold or market share, and changes to these indicators can easily be tracked. Marketers can also compare growth rates with those of the market, view percentages of revenue used for R&D and marketing, etc.
This app addresses one of the most significant challenges faced by large companies. Brands can compare their own various different indicators, in addition to comparing their company’s performance with that of their direct competitors.
Your marketing reporting should allow you to accomplish these tasks. Seeing how your brand’s figures compare to the market and to your competitors can facilitate the decision-making process that will improve your company’s performance.
Charles Miglietti, co-founder @Toucan Toco
ABOUT TOUCAN TOCO
Our mission: tell Business Performance Stories through interactive Data and Data Storytelling.
Our users: Marketing, Production, Finance, Human Resources, SalesForces and Top management of Big Companies.
From 4 to 55 people in 4 years, more than 100 clients, 260 projects among them: Renault, Total, Axa, BPCE, EDF, JCDecaux, Téréos, Psa, Marques Avenue, lvmh, Euler Hermes, Vinci, DCNS, BIC, sncf, seb, Moët Hennessy, La Banque Postale…
Small apps are mobile, easy to use, made for action and easy to set up in any information system.
