Absenteeism in the workplace is a costly issue for any company, regardless of its size. Being able to monitor absenteeism, but also its causes, is a key mission for human resources managers.

HOW TO MANAGE ABSENTEEISM MONITORING?
Previously helpless when faced with this issue, HR departments now rely on a large number of indicators to identify this phenomenon and implement good practices to remedy it.
To learn about other specific user cases, we also wrote an article on recruitment issues.
Understanding data better
But having the right indicators is not enough; especially if the data collected is used poorly, or not at all. This is where data visualization and data storytelling come into play.
Not only is data analysis simplified with dashboards that centralize information, but it also makes it possible to tell a story using this data and understand the exact origin of the phenomenon.
These HR dashboards facilitate the analysis of the causes of absenteeism and can outline the most affected employees. They can also improve decision-making and support problem resolution.
An HR reporting tool for absenteeism monitoring
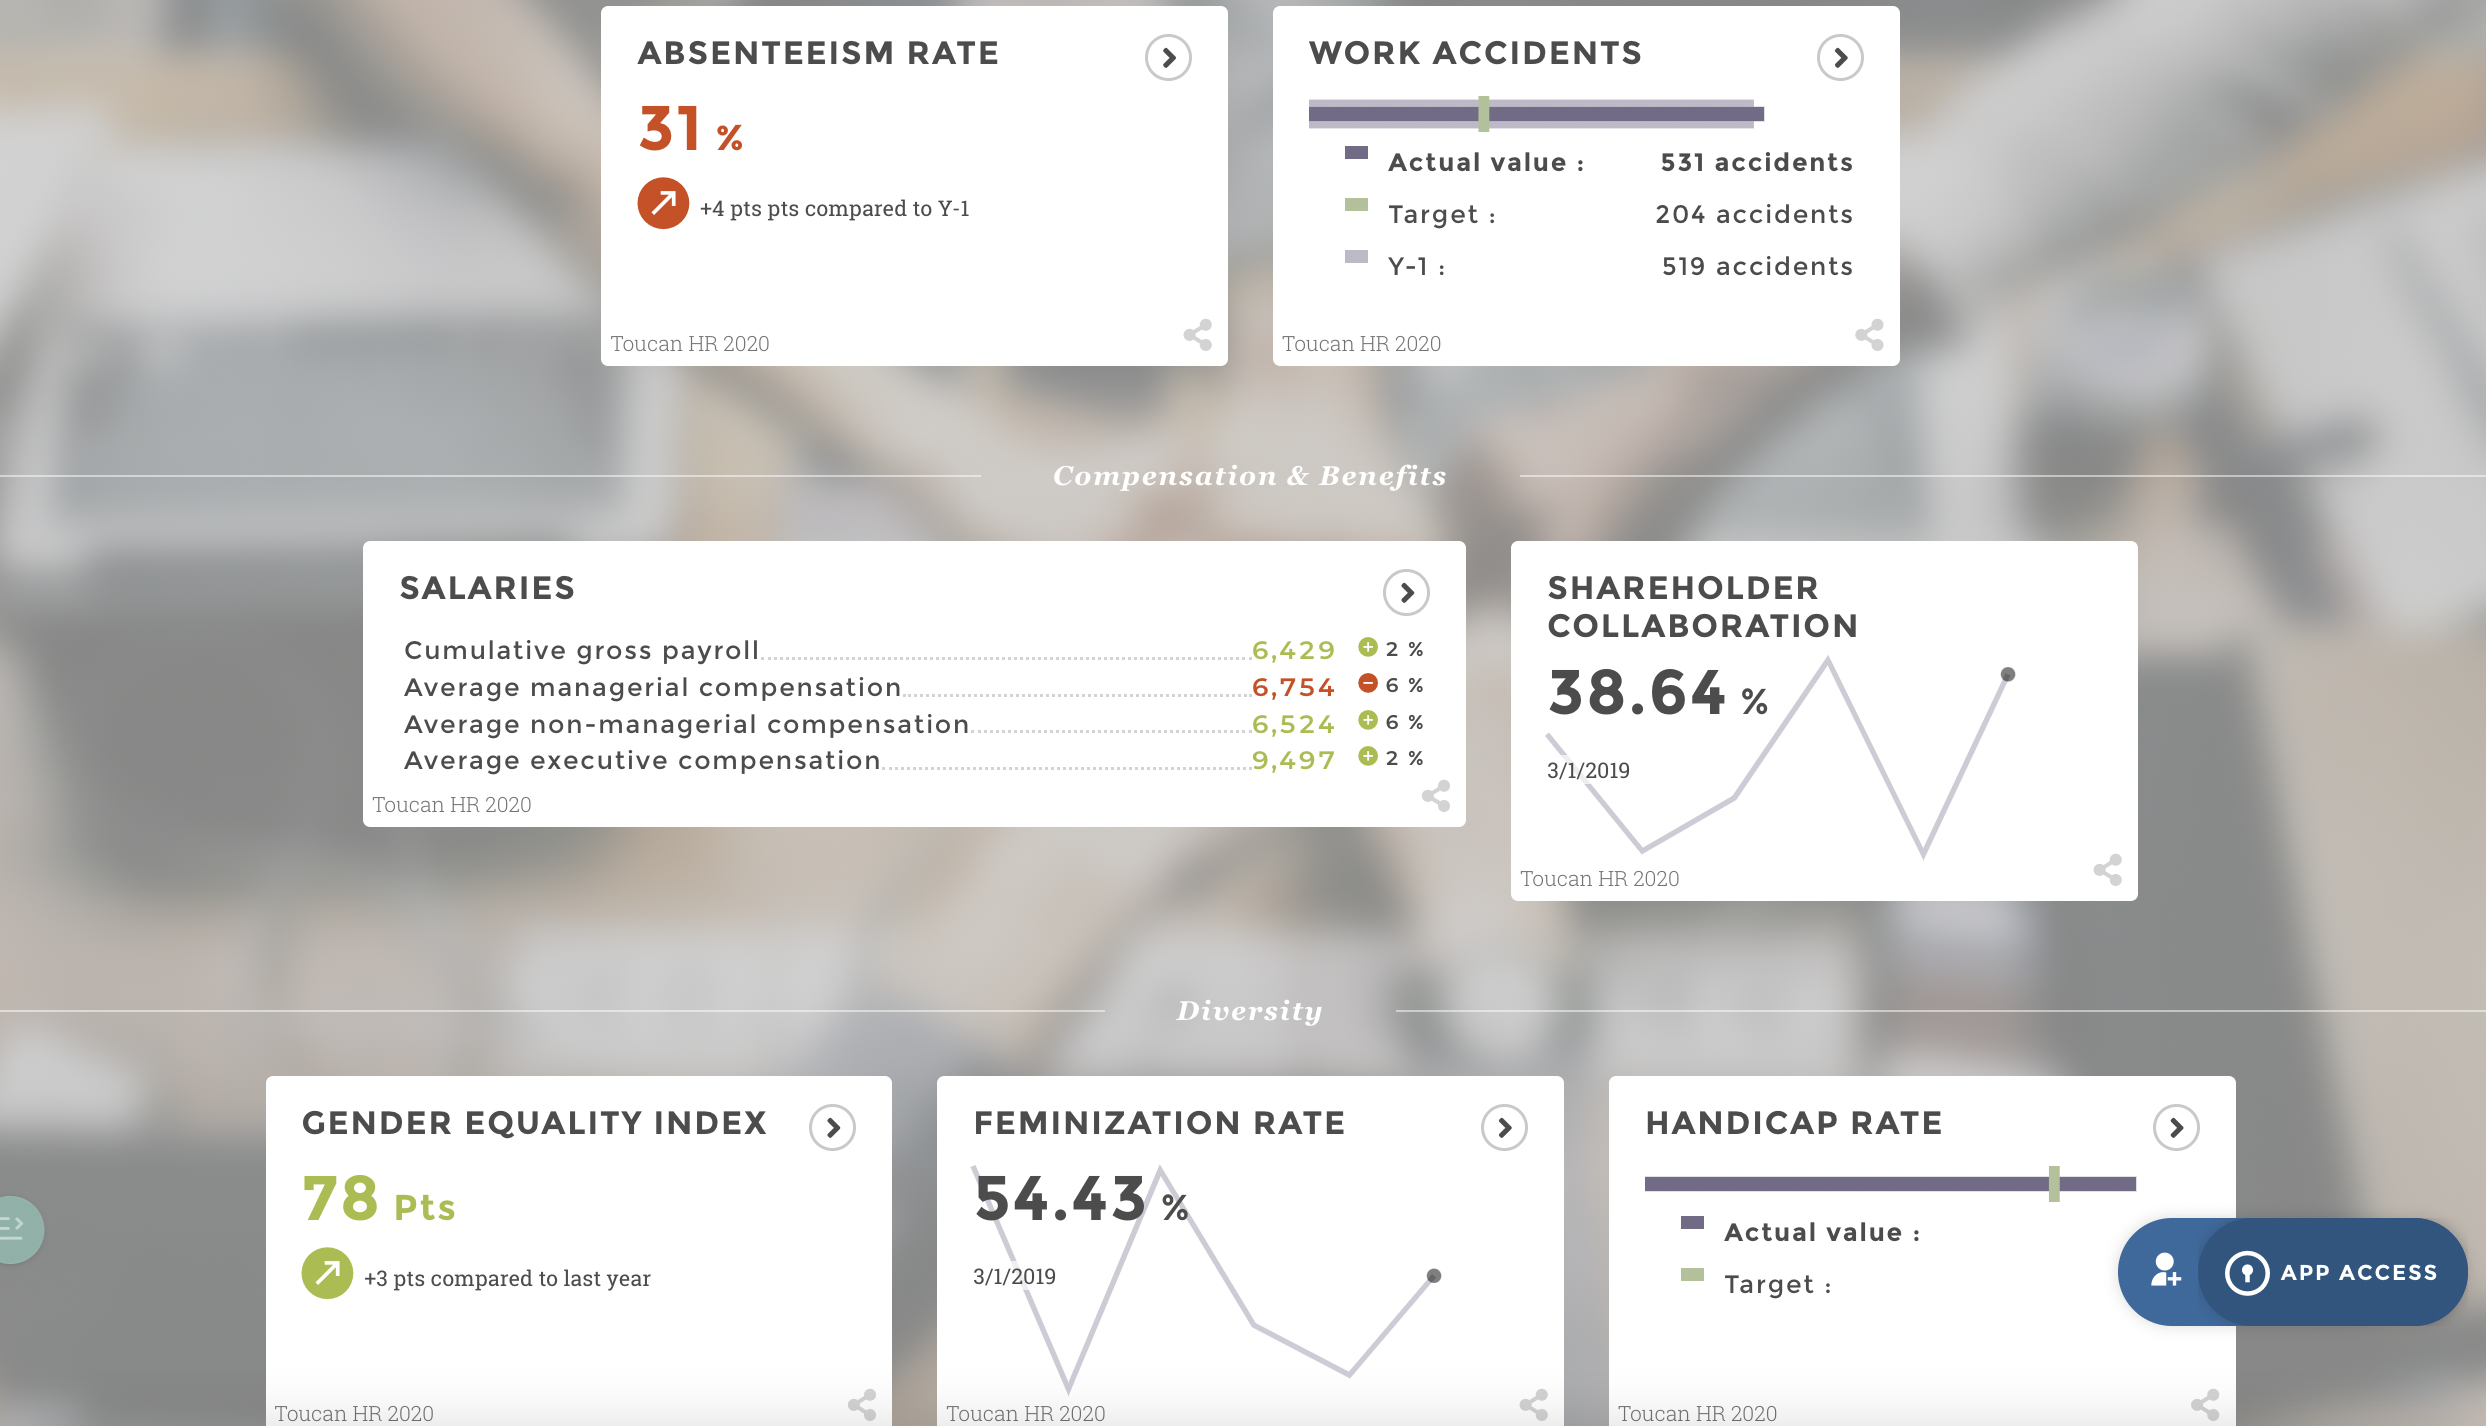
Here is an example of a dashboard designed for absenteeism monitoring. It allows a comprehensive understanding of the problem. It includes key HR indicators that can help identify the phenomenon’s origin.
How to organize your dashboard?
To be easily readable and understandable by everyone, your dashboard must be compartmentalized. Here is a reading grid to help you find your way around all the indicators at your disposal.
Segmenting by cause
This dashboard makes it possible to monitor the evolution of absenteeism over time, but also track the main cause for absenteeism for a given period.
You can quickly find out if the increase in absenteeism is rather due to workplace accidents or maternity leave for instance. Higher degrees of accuracy can be implemented into the analyses, such as assessing absenteeism caused by illness.
Focusing on socio-professional categories
Using this filter, one can assess − for a given period − the rate of absenteeism according to socio-professional categories. This can quickly reveal which cause of absence is more frequent among managers, workers and maintenance agents.
Monitoring the frequency and severity of absences
This visualization not only helps track the severity of the cause of absenteeism but also the frequency at which this cause is invoked. Further analysis can be done by assessing the age and gender of employees in every socio-professional category.
You can also specify the duration of absences (short/long) depending on the activity.
Managing absences over time
The reporting makes it possible to highlight the evolution of absenteeism over a given period of time, and measure the impact of a policy aimed at combating this phenomenon.
Comparing your company with the overall industry
Positioning yourself in relation to your field of business can provide a comprehensive overview of the industry’s situation. It can also be a great way to understand what may or may not work for your competitors.
Take advantage of HR reporting Tool!
These HR dashboards make it possible to quickly identify the causes of absenteeism, the frequency of the phenomenon, the employees most affected within the company, and assess its severity. They help simplify the analysis of HR indicators for human resources managers so they can focus on implementing an action plan to solve these issues.
You want to learn more about this matter? Come and discuss it with our team dedicated to HR topics!
Learn more about Nexity‘s experience, a company that has chosen a data storytelling tool to address its HR issues.