CHALLENGES FACED BY FRANCHISES
Like every other industry, franchises are facing an inundation of digitization in the tracking of company processes and data, and franchisors from management to brand-management levels can improve operations and boost progress by drawing more effective insights from data collected through digitization.
The greatest revolution of the 21st century is the collection and use of information. Franchises have more data than ever before to work with, but drawing insights from this data and disseminating that information is the greatest challenge to follow.
Therefore, there needs to be a centralized place for all of this data so it can be consulted easily during the decision-making process. Information on products, customer behaviour, conversion rates, and store locations and performance is helpful, but useless without an understanding of the data throughout different levels of management. That is exactly where an effective dashboard summarizing the most valuable data and indicators becomes invaluable in your franchise’s operations.
WHICH INDICATORS DO YOU NEED?
Franchises are becoming increasingly complex, and organizations need to manage ever-growing quantities of information.
Effective reporting is paramount: a dashboard that will give managers and other stakeholders daily access to the data they need, even offline, is essential.
It is also important to choose the right KPIs. In a franchise, having access to an overview of the right KPIs, with both short and long-term data, is key.
An effective dashboard offers your company the opportunity to make improvements in a variety of different areas by providing detailed data on:
- Your customers: Better customer knowledge means improved branding and targeting.
- Your franchise POS: Being able to draw and share insights from your sales performance means being able to streamline your products or services.
- Your market: More comprehensive knowledge of the market and products, with a clear perspective on the different sales channels and markets in which your brand is present, as well as more detailed comparisons with competitors can all help improve your position in your market.
- Your performance: Your team can clearly see the opportunities available to them, leading to improvements in the team’s performance, as well as a reduction in turnover and greater profitability for the company, and an increase in revenue.
EXAMPLE OF A FRANCHISE DASHBOARD
On the homepage of this retail dashboard, you will be able to see a detailed overview of your company’s activity, and various different types of data:
.webp?width=697&name=image2-1024x418%20(1).webp)
An overview of different markets, sorted by geographical area, with information on sales turnover, cash flow, customers, profitability, and whether or not goals have been achieved.
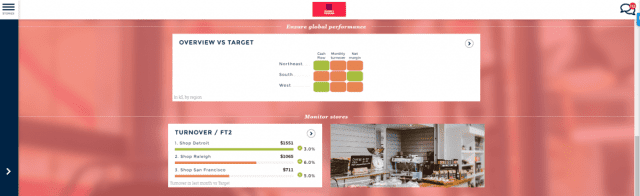
You can also see a detailed perspective on combined and monthly turnover, as well as sales performance indicators.
Lastly, several operating indicators are displayed, including net margin, disbursement and cash flow.
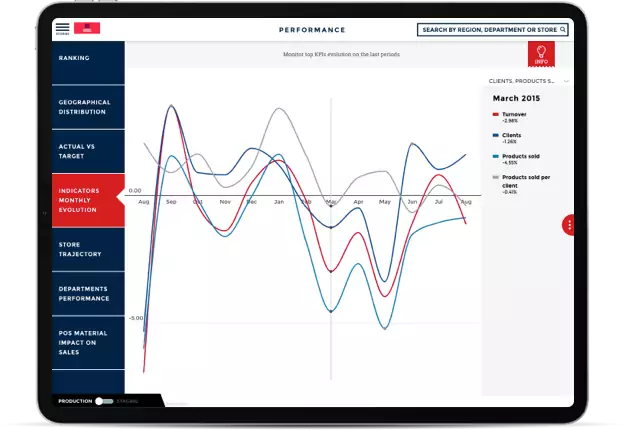
1. PERFORMANCE– SALES INDICATORS
In the Performance section, you first see a short-term view of sales performance.
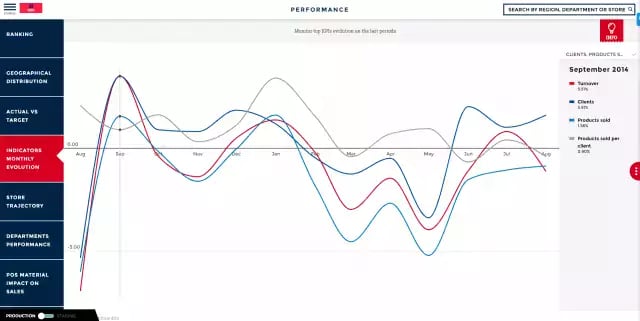
You can also see how different indicators, such as turnover, clients, and products sold have evolved over the year.
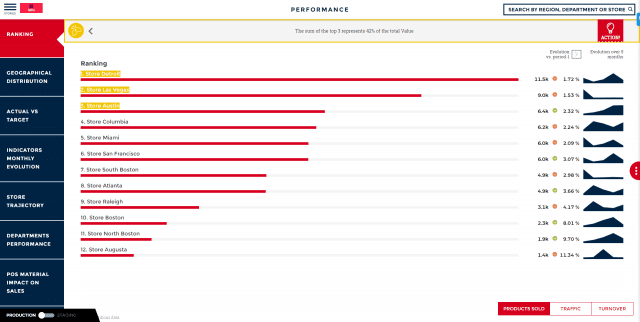
Finally, this section offers a detailed look at store performance, which can help improve the dissemination of best practices.
You can also consult performance indicators, shown by geographical area: performance results compared to the previous month, as well as whether or not sales turnover goals have been achieved.
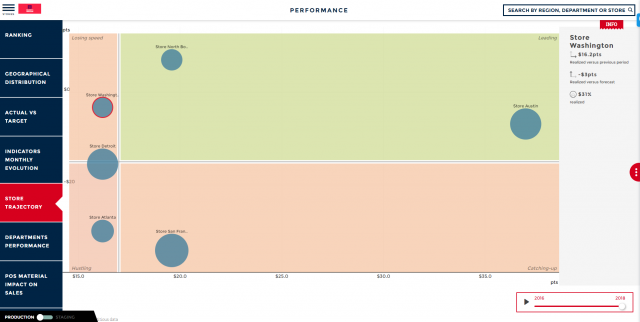
2. PERFORMANCE – STORES AND GEOGRAPHICAL AREAS
This section enables you to evaluate the progress that has been made, view rankings that show the performance of different stores, and take a look at goals that have been set for different geographical areas.
Wonder how it looks in action? Watch it in a complete video: Toucan - Food Chain and Restaurant - Dashboard creation | 17:36
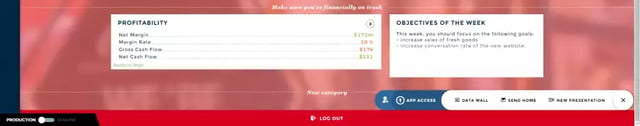
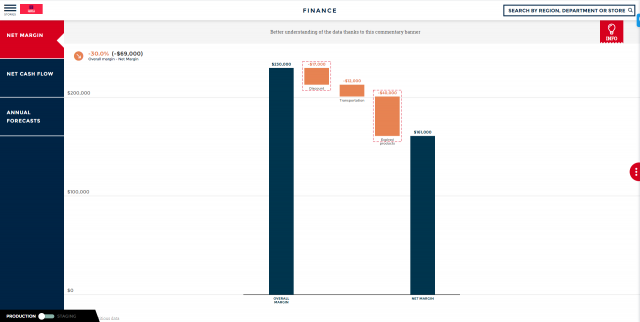
3. PROFITS
In the profits section, you can see a synthesis of the data, as well as information on the net margin and net cash flow.
The net margin enables you to evaluate the company’s profitability.
4. CARTOGRAPHY
The cartography section shows where stores are located in a given region. You can also see where your clients are located, and consult a detailed map of the stores.
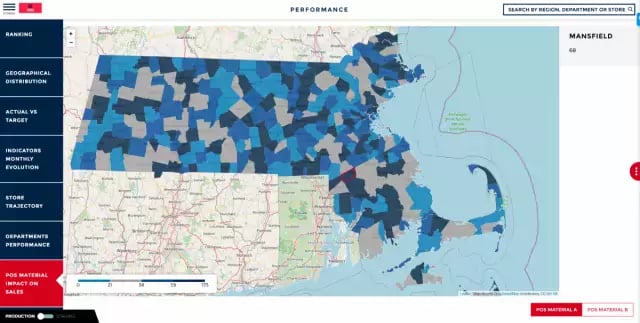
Here we can see a map of Massachusetts, showing the number of stores in each county.
KEY POINTS ON FRanchise REPORTING
This retail dashboard offers a wide range of different indicators.
It is important to use a steering tool that is well-adapted to the data you are working with, as well as the various different sources of this data.
A dashboard facilitates both internal and external communications, making it quicker and easier to share information. Your reporting is also accessible from anywhere, even offline. This tool makes it easy to know which decisions to make in order to improve your company’s performance, growth and competitiveness.
You’d like to go further?

.png)