Whether you’re a CTO, VP of engineering, or engineering manager, you would like to lower the average self-declared 31.6% efficiency loss of developers according to Stripe. But as an engineering leader, there’s more to your mission than sheer numbers: you need to lead your pool of talents by promoting a culture based on growth and collaboration while keeping everyone’s eyes on the prize.
You know that software developers crave self-empowerment and independence rather than strict reporting. Embracing an agile management style can allow you to help your teams improve continuously through short iterations and to fix problems in their early stages before they impact everyone’s workflow. What you need are the right tool and insights to fuel your management and empower your high-performing engineering team.
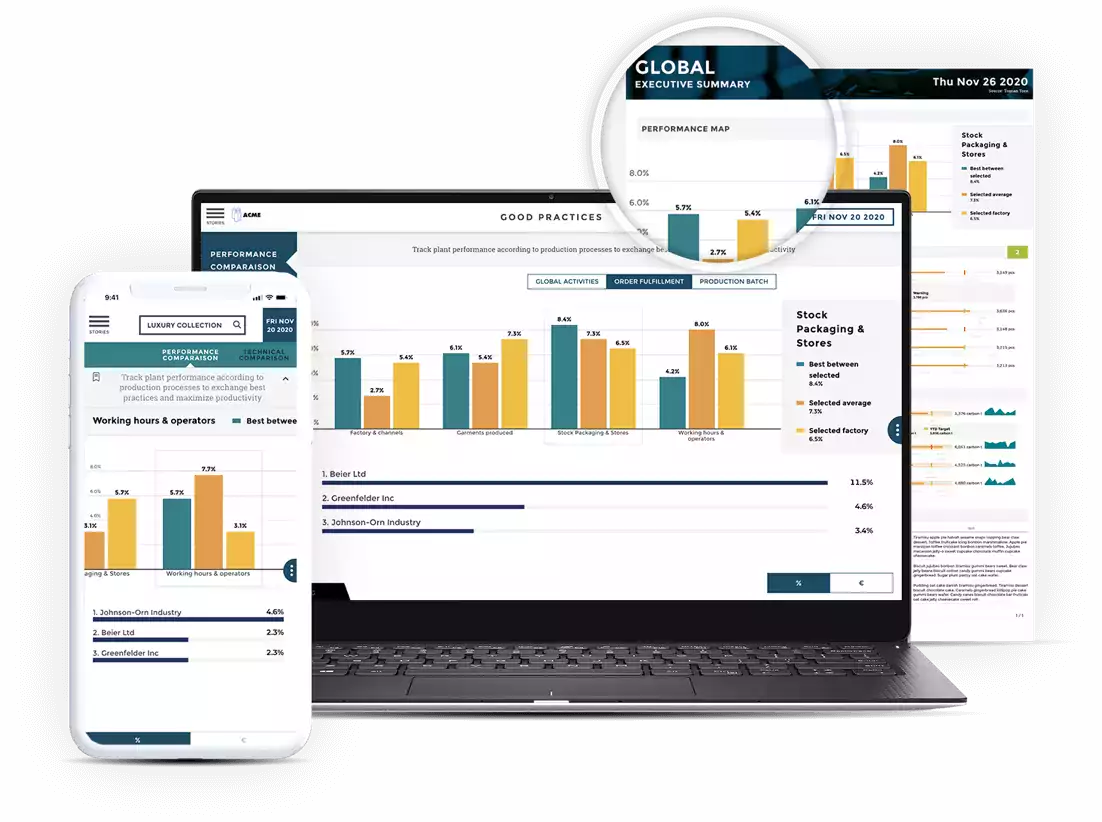
The good news: there’s a handful of Git Analytics metrics that will give you a bird’s eye view on your team’s progress in each repository and that will allow you to spot potential bottlenecks before they become a problem. Pulling data out of Github can be complicated and time-consuming, but there are apps natively built for Github that will allow you to visualize these relevant KPIs in less than one minute.
1- Number of Merged Pull Requests Per Day
This metric will give you the big picture of your team’s review process over a period of time. Whether you’re trying to understand the outcome of a sprint or looking for general trends, the evolution of merged PRs is generally a good place to start.
It won’t be enough to tell the whole story, but it will allow you to compare your team’s productivity in particular repositories and overall. A steady rise in the number of Merged PR is usually good news while plummeting numbers can mean pull requests are too long or too complex. You’ll need to cross-reference this useful metric with some of the more precise KPIs below to know what to do next.
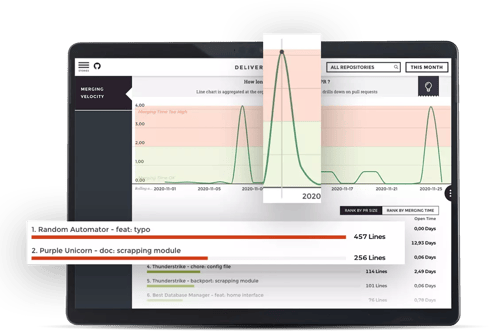
2- Evolution of Average Merging Time
A plummeting number of merged pull requests coupled with a longer average merging time can mean that PRs are spending too much time in review. This can be due to a couple of factors, including pull requests that are too long. Longer merging times with a number of merged pull requests that remain constant can mean that your teams have too much on their plate or indicate a lack of clear responsibility and reviewing.
Make sure to keep an eye on their workloads to avoid having them swamped. In any case, merging times that go beyond a certain number of days should be a red flag: cross-reference this information with the number of lines in pull requests to get a clearer picture of the situation.
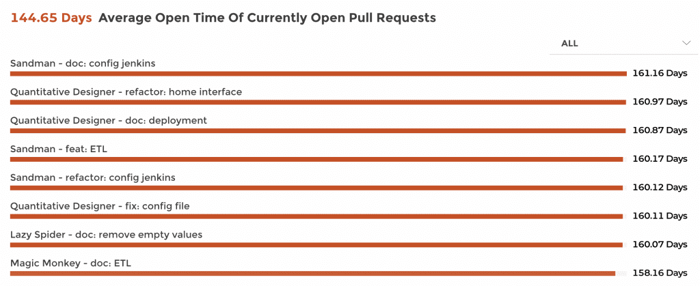
3- Average Open Time of Currently Open Pull Requests
The first two KPIs we’ve listed allow you to understand how fast the developers on your team have been working. Take a look at the number of open pull requests if you want to understand their current workload. Ranking them by average open time can help you spot bottlenecks and PRs that are simply too long and need to be divided into more manageable chunks. Comparing these figures for each repository will allow you to understand which part of your codebase is lagging behind.
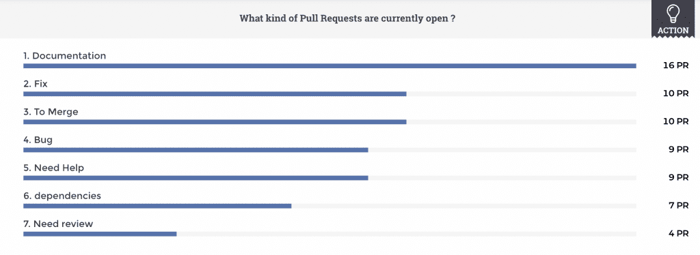
4- Number of Open Pull Requests Per Category
The way you classify the pull requests in your repository depends on your company’s internal organization. Tags allow you to have a better understanding of what you’re dedicating your development effort to. This is why these classifications are always relevant to you: monitoring the number of currently open pull requests per type will allow you to get the big picture on what members of your team are spending most of their time doing: are they devoting their working hours to debugging or to writing documentation? Is a big chunk of pull requests stuck in the review stage due to a possible lack of managers reviewing the code?
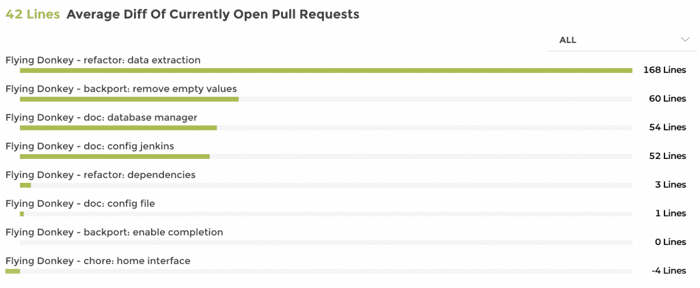
5- Average Difference Size of Open Pull Requests
The average difference in the size of open PRs allows you to understand how complex the pull requests currently on the table really are. When this number is high, it means your code is going through some substantial changes that will understandably take your team more time to review and merge. A high number of lines in your pull requests can explain an unusually high average open time. A negative number of lines, on the other hand, means the code is being gradually simplified.
If you filter by repository, you can spot the ones that are more resource-intensive. There’s such a thing as an optimal length of pull requests, and it varies for each organization, but it’s usually on the shorter side. The problem with making all your PRs very short is the transaction cost for creating, reviewing, and merging each request is usually non-negligible: you can work on making it shorter by adopting lean methods of collaboration.
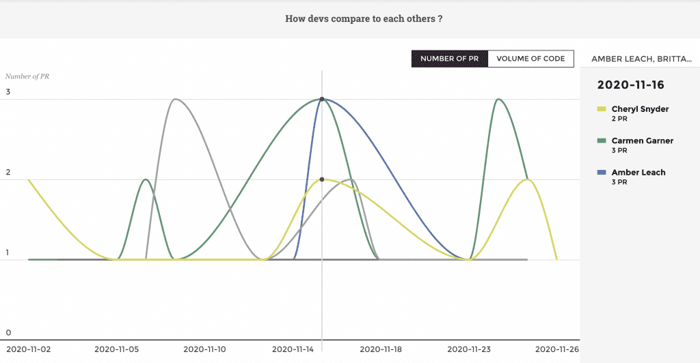
6- Number of PRs per Developer per Repository
After getting a global view of the size and merge time of your PRs, you might want to dive into the individual development effort put forth by your team. An important metric to have at hand is the number of PRs merged by the developer for each repository. This will allow you to get a more accurate mapping of your team’s competencies and will be a starting block to build a much more useful skill matrix for your team. This granular knowledge of each developers’ strong suit will ultimately help you make better staffing decisions, monitor your developer’s growth in competency, and spot potential skill gaps to know who you need to hire.
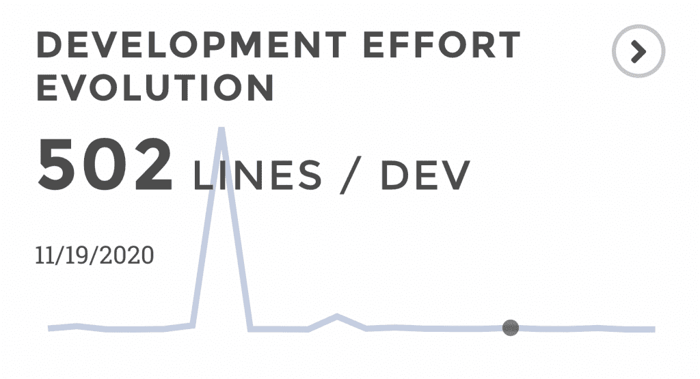
7- Average Daily Lines per Developer
Complement the previous KPI with the number of lines per day and per dev. Knowing the average daily lines written per developer will allow you to identify developers with a higher propensity to deliver big chunks of code: either they are staffed on heavy topics or their squad should refine their tickets into smaller pieces.
8- Top Contributors by number of PR
Monitoring the overall performance of your developers and ensuring processes flow smoothly is only part of your job. As an engineering leader, your main mission is spotting the rockstars on your team and allowing them to share their knowledge more broadly and effectively. Make sure their talent doesn’t go unnoticed by watching your top contributors by number of PRs. This will allow you to identify outliers in each repository and encourage them to show others how they do what they do. As an empowering leader, you want to rely on the best members of your team to help others grow.
You’re one minute away from getting insights through these engineering team KPIs.
You might think tracking these metrics is time-consuming, and wonder if there’s a safe and secure way to draw all necessary information from Github directly and facilitate team communication in software engineering. We think we can help: our Github app is free to use and allows you to access your data insights directly, using your Github credentials.